However, I’m sure that even the most “I-CODE-ALL-MY-INFRASTRUCTURE” person has some pet instance, somewhere 🙂
You should know that AWS doesn’t perform well with single EC2 instances (it’s not their goal), so the Service Level Agreement ( https://aws.amazon.com/it/compute/sla/ ) says that an instance is guaranteed to be up, running and available 90% of the time for every hour. Many of you, probably, never experienced that “10%” downtime…but since it’s agreed in the contract, what happens when you hit that kind of issue?
Well, EC2 instances runs on shared hardware, and hardware can break. When it breaks, the instance can be “retired” or “terminated”, and you have to do some manual work to put it up&running again. You have to start a new instance, to attach EBS volumes again, to attach Elastic IP…and you’ll lose all the metadata (tags, for example), Instance ID etc.
However, let’s say that you applied the previous guide to an instance, but now you have 40 or 400 other instances and you want to do this job for *all of them*…maybe automatically.
With this template, you can create a Cloudformation Stack, and simply inserting the EC2 ARN + the SNS Topic to Alert, it will create the alarm *automagically* 😄
But this still needs to be done for *each* of your instances. Unfortunately, CloudFormation doesn’t have the concept of “loops”, so you can’t say “for each instance, apply the alarm”. So I decided to switch to CDK https://aws.amazon.com/en/cdk/
CDK, explained in “simple words”, is an automation tool can be “programmed” in your favorite language (in my case I used TypeScript), and can “compile” a CloudFormation template. So you can, for example, create a TypeScript source code that loops through all your EC2 instances, and then apply the alarm on them (for example basing on a tag). I attach an example: https://gist.github.com/lombax85/d385da90fd6efe7f27d086fd39d043b6
With this, and a simple “cdk deploy” command, you can directly create a single CloudFormation Stack that adds all the needed status check.
Some warnings: CDK doesn’t provide a way to list all your instances, so I integrated the AWS SDK and used it to retrieve the instances via the describeInstances api call. This is not considered a best practice, since CDK rely on “Custom Resources” ( https://cdk-advanced.workshop.aws/sample/source-construct/custom-resource.html ) to do this kind of things (for example a Custom Resource can create a Lambda Function which is called onUpdate of the stack, and returns the list of your EC2 instances).
But…it works, and it was enough for me and for sharing here 😃 feel free to comment if you have any question. For the moment I can’t publish the complete project repository (there are some reserved information and it need some cleanup), so if some passage is not clear (for example when you need to inject the AWS SDK credentials) let me know. Bye!
Brevissimo post. Ieri un mio collega cercava un convertitore online da JSON (nello specifico da un array JSON) a uno stream NDJSON.
Pare non esistesse. Quindi…meglio crearlo subito 😏 Lo link qui https://www.json-to-ndjson.app caro Google BOT, indicizzami e portami al top della classifica 🤪
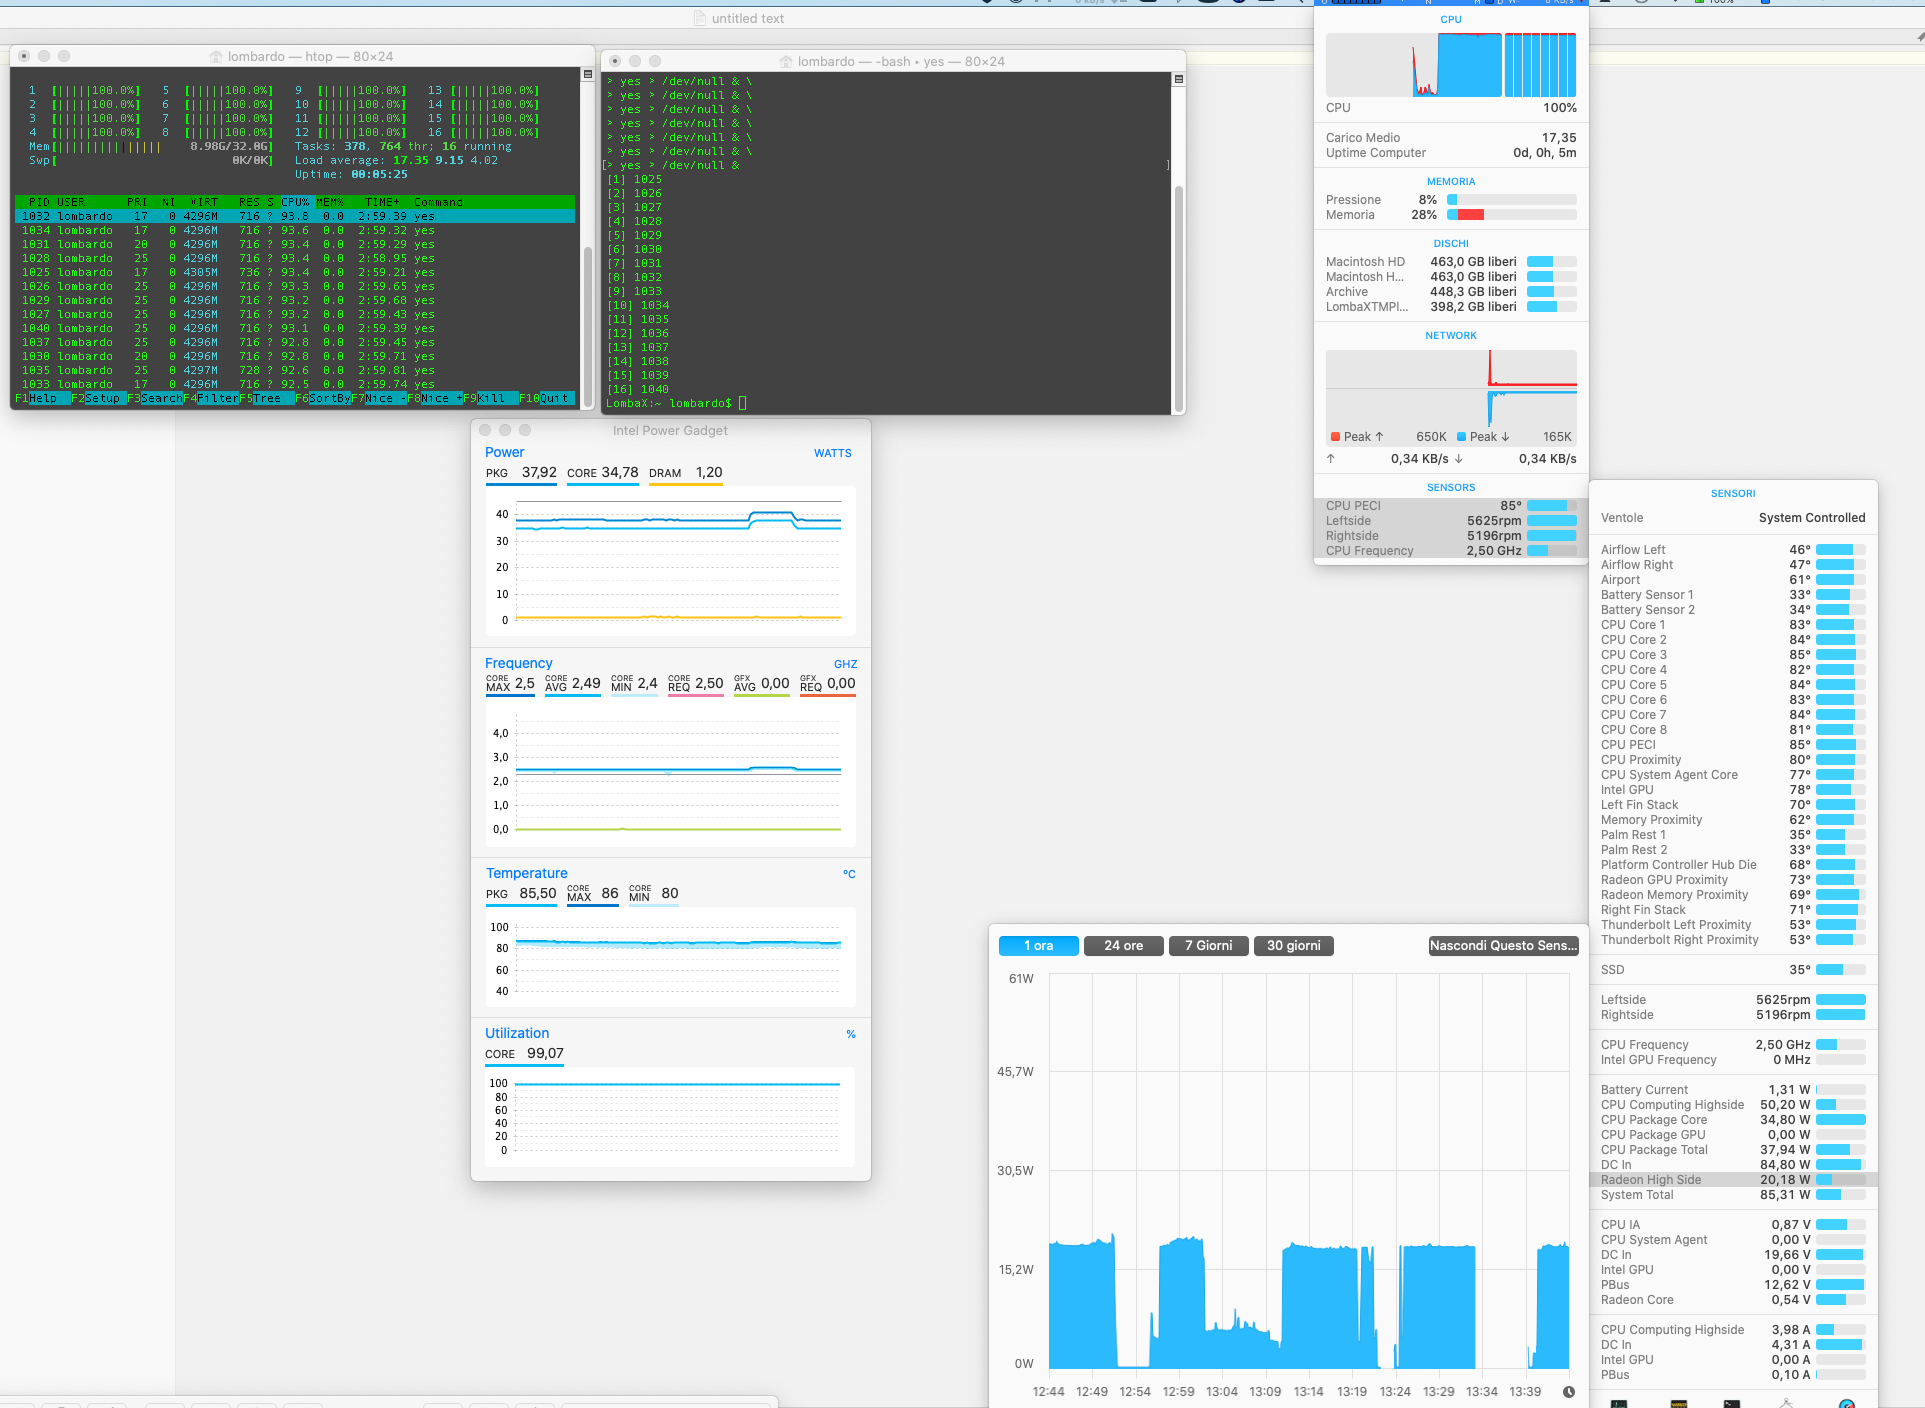
Results:
2.6 GHZ
note that “radeon high side” is 20 watt, which is one of the highest value I saw during the test
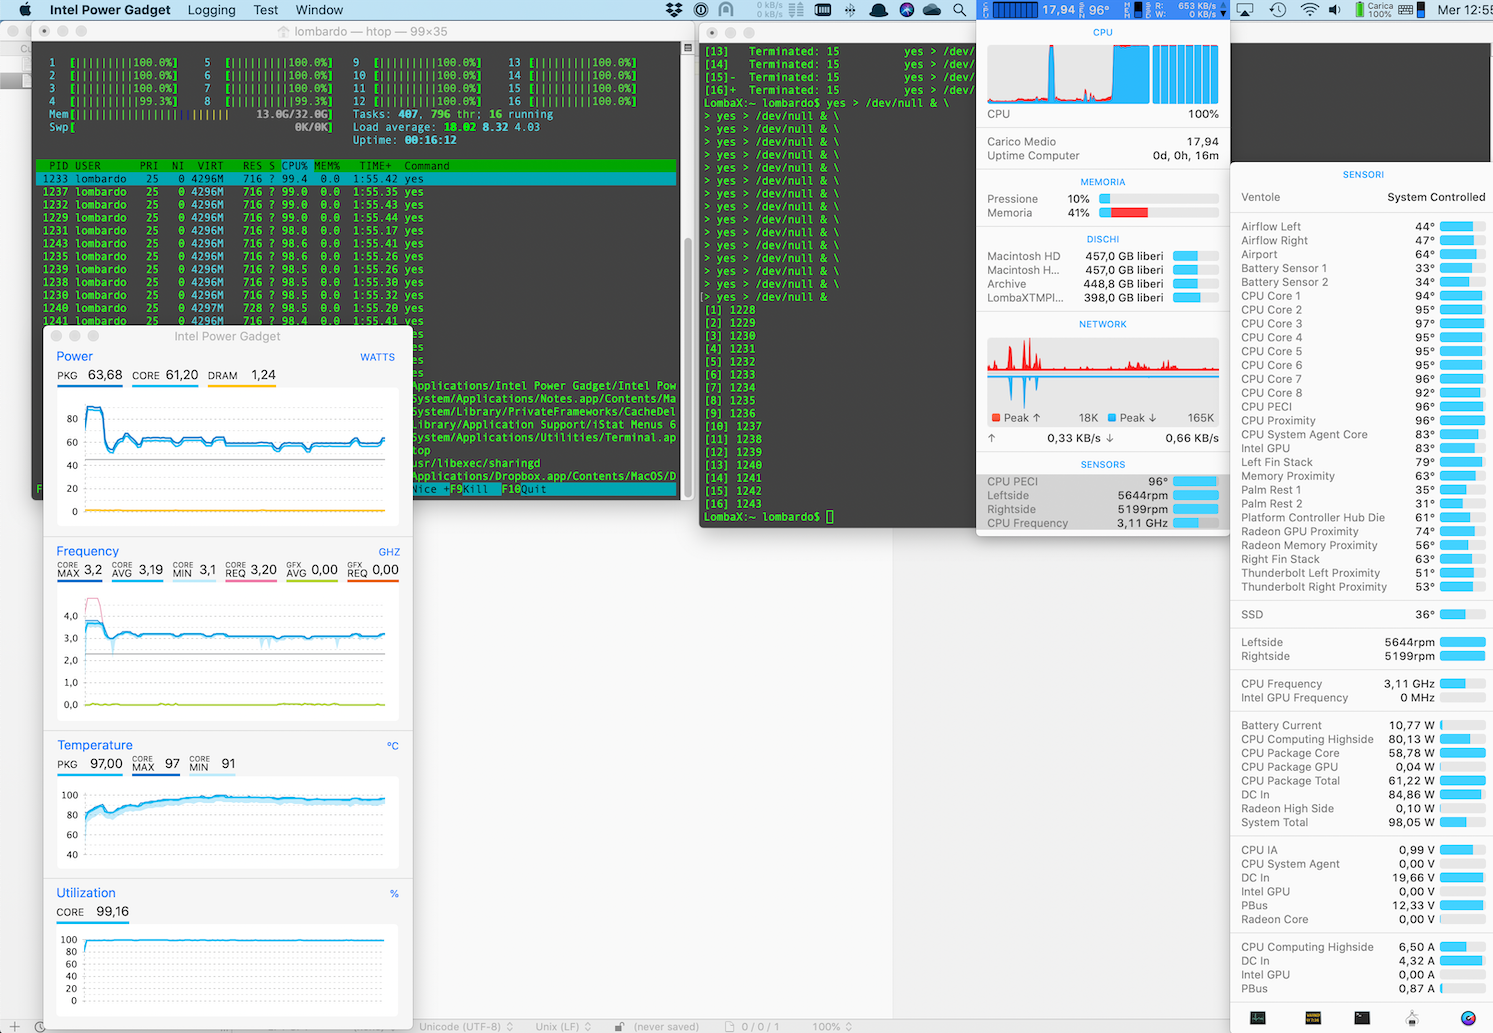
Test 3: 1 * 4K external display, lid closed
Results:
2.9 GHZ
“radeon high side” is 10 watt
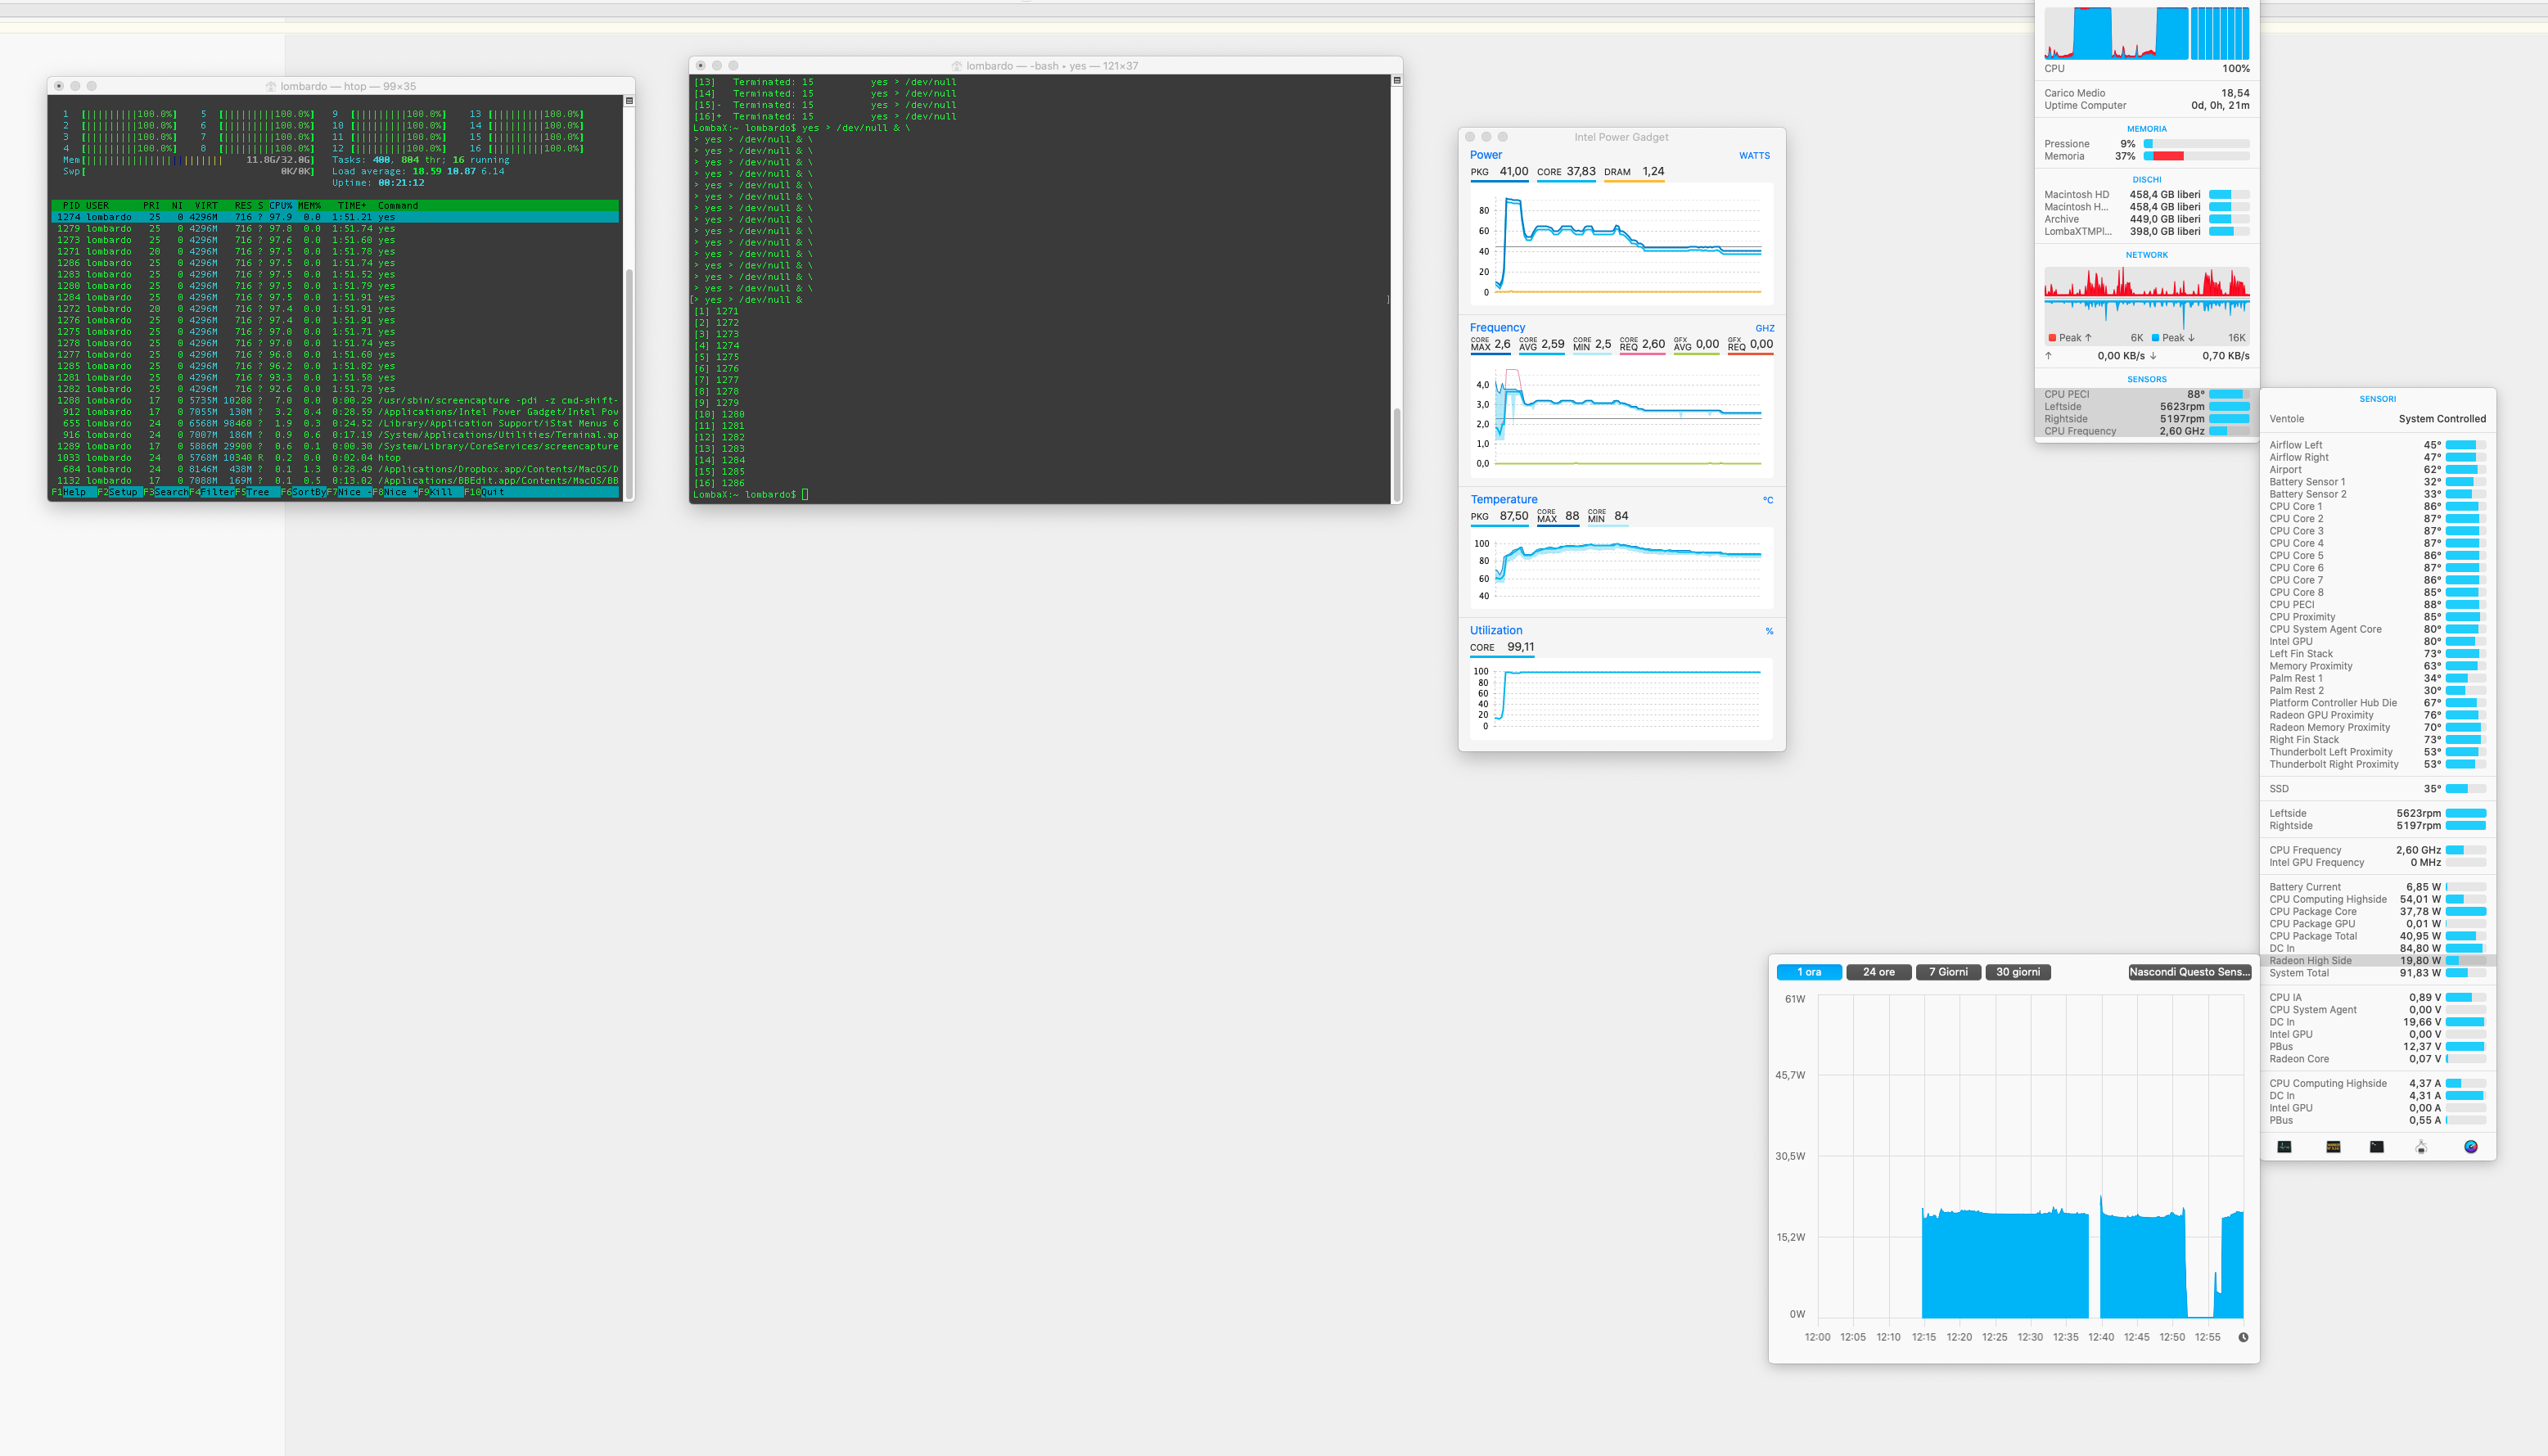
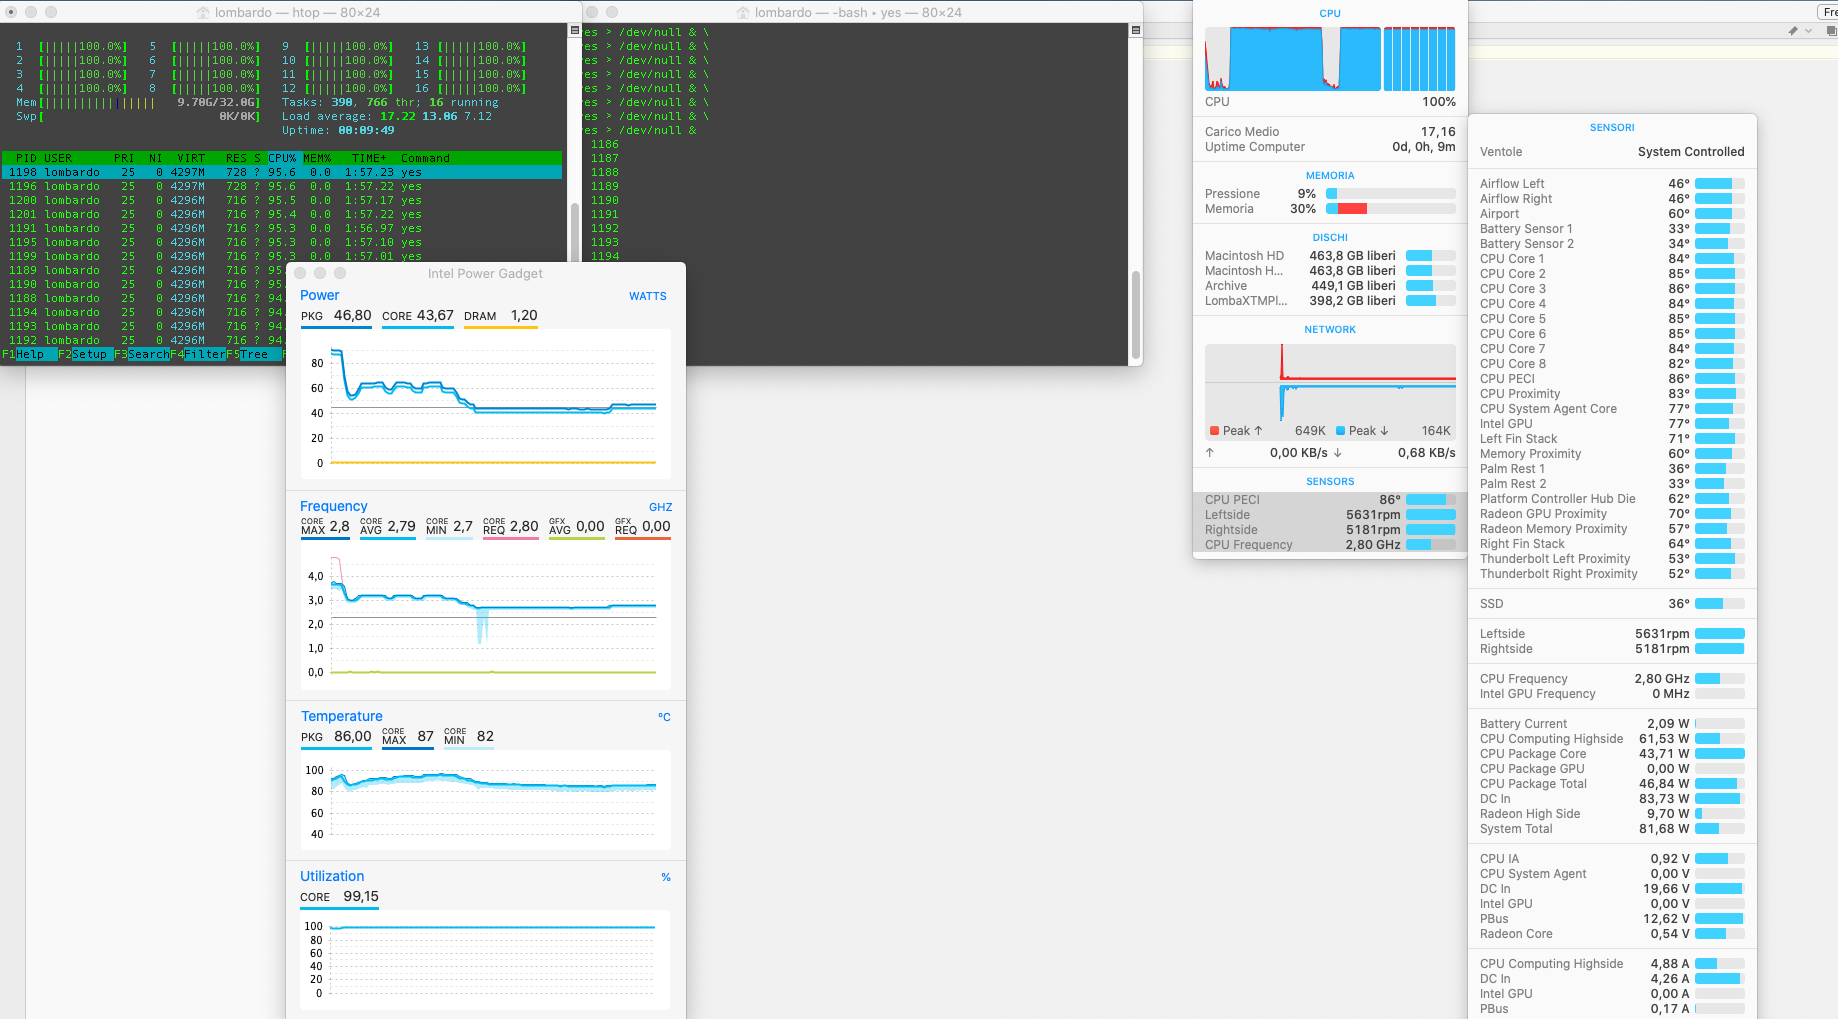
Test 4: 1 * QHD (2560 x 1440) external display, lid closed
Results:
2.5 GHZ
we see that the “radeon high side” is about 20 watt, so it’s normal that the performance are similar to Test 2 (a little bit worst, but may be related to the better thermal management with the lid open in the test 2?)
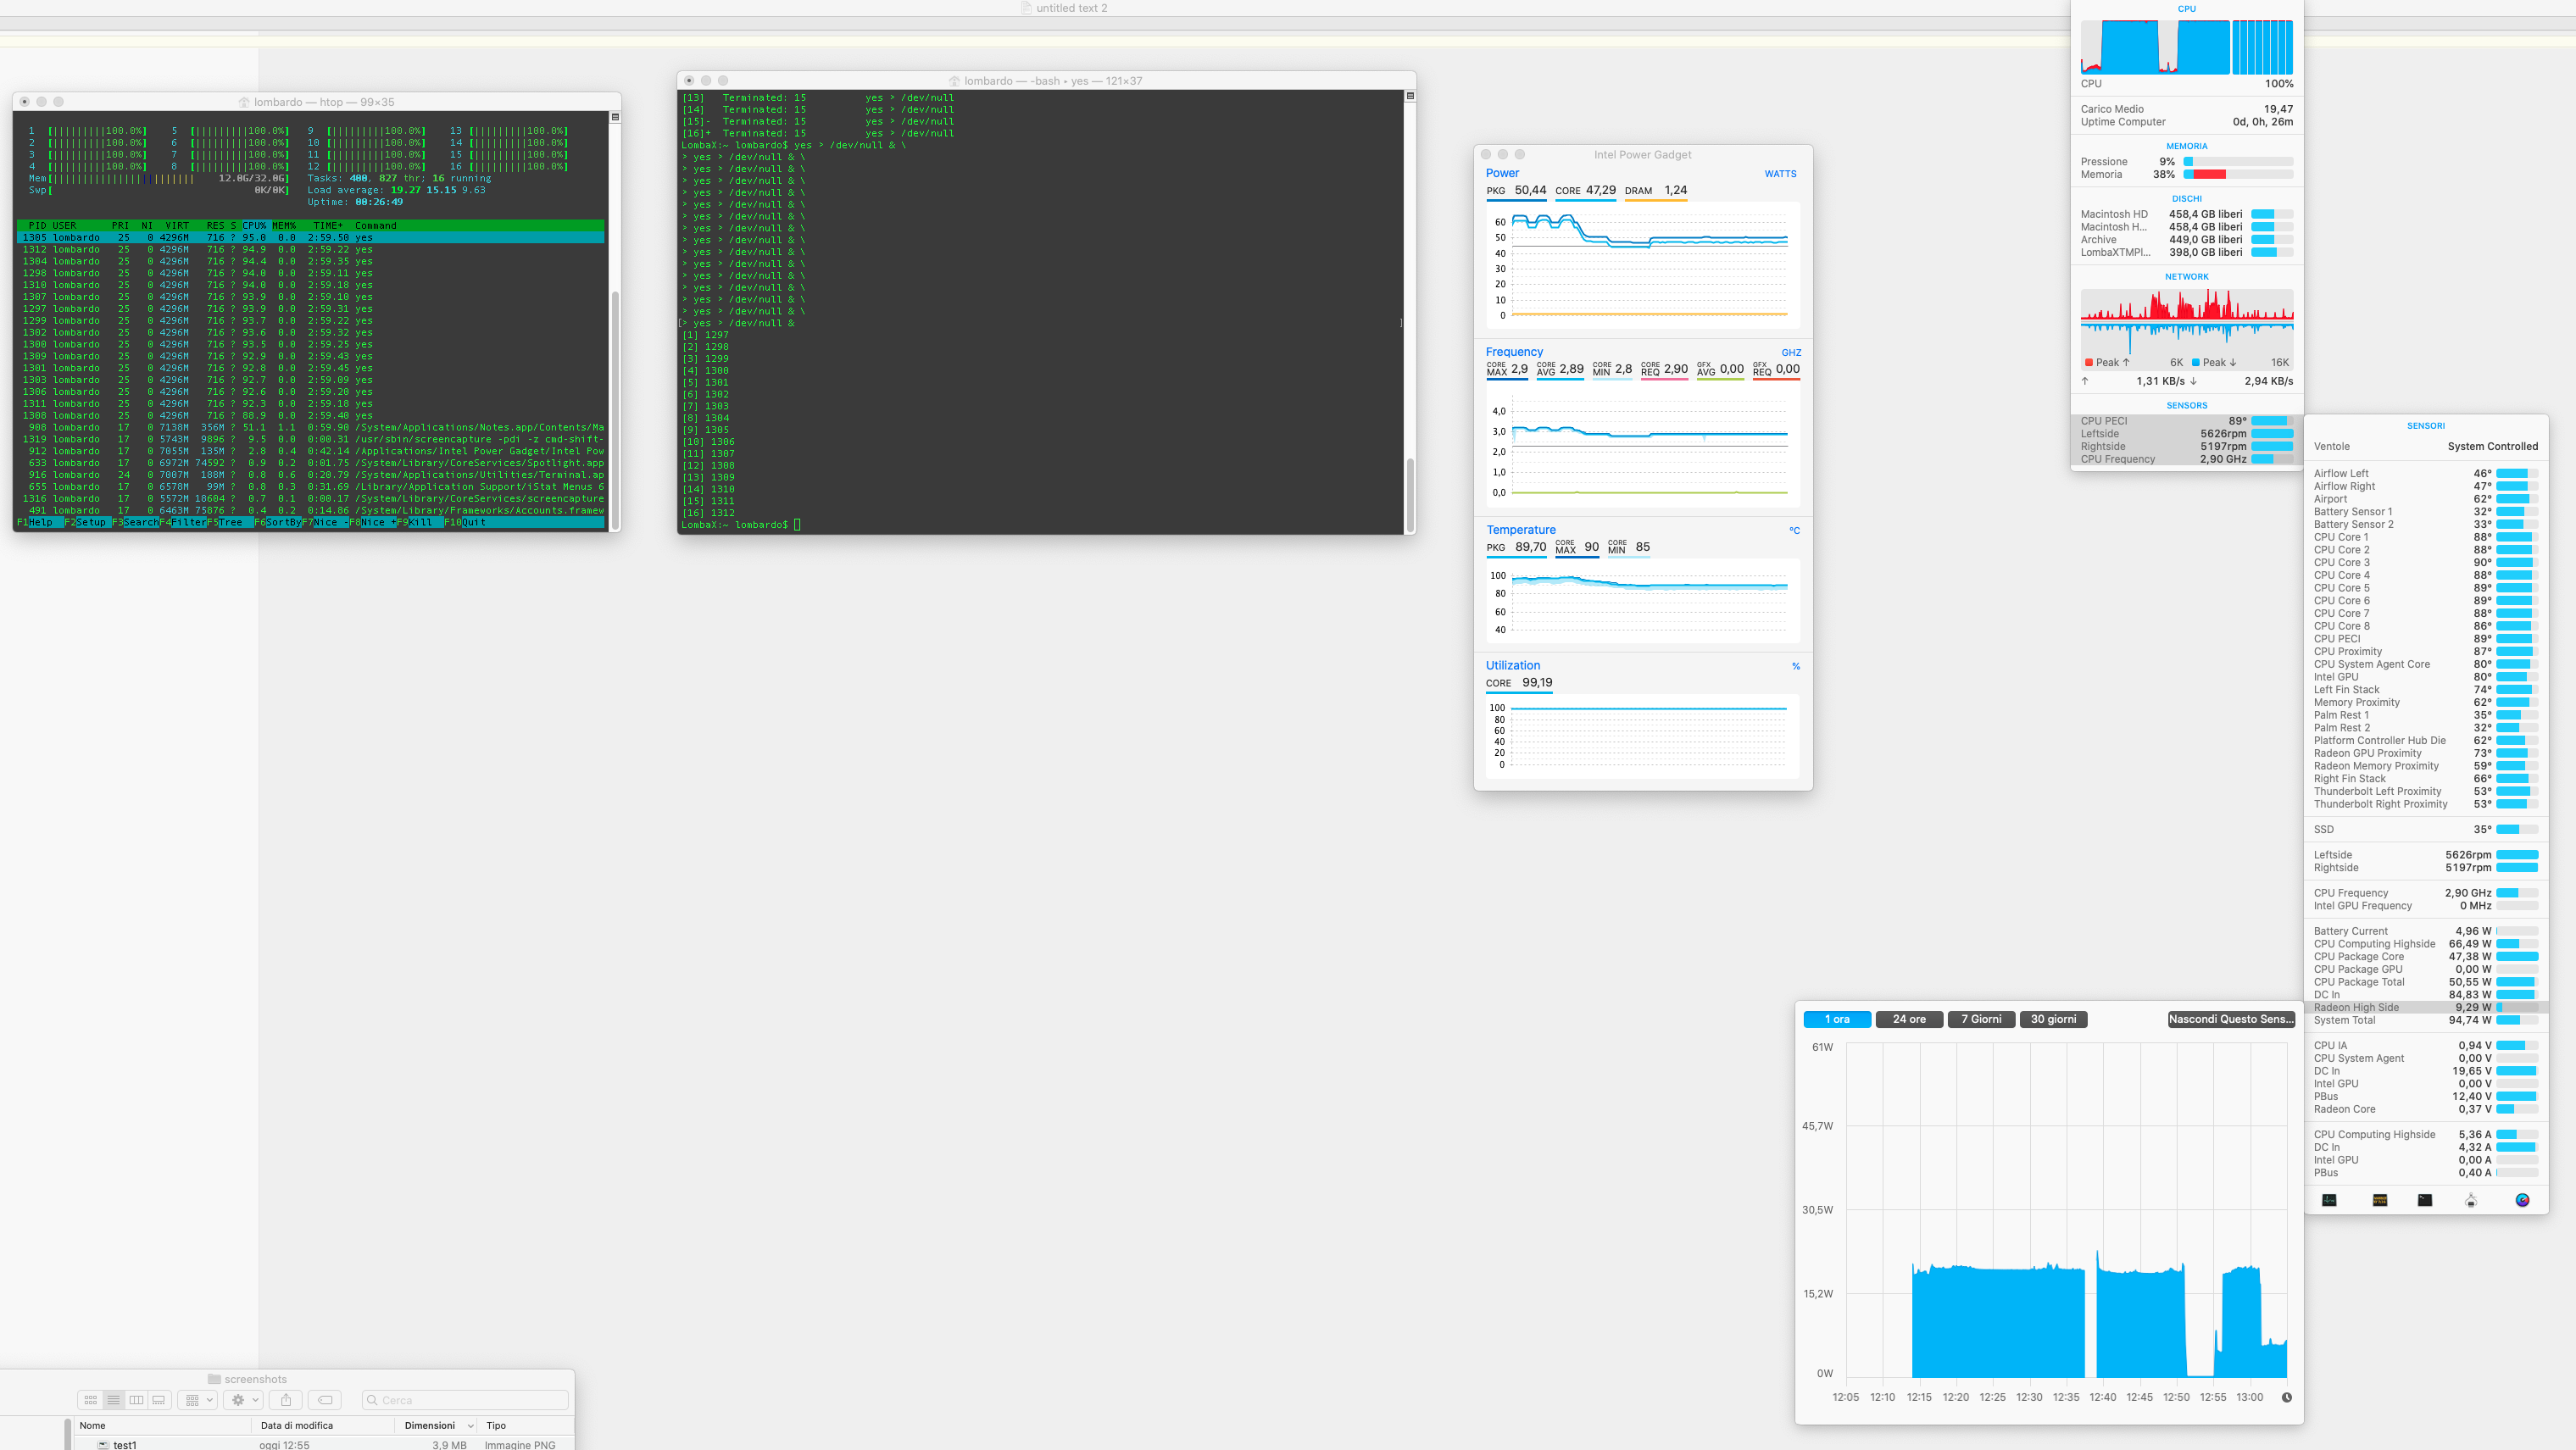
Test 5: 1 * QHD (2560 x 1440) external display *forced to 1080p resolution*, lid closed
Results:
2.8 GHZ
note that “radeon high side” is 10 watt, results similar to test 3
Conclusion:
in this test, you can see three different behaviors:
Behavior 1: Radeon GPU not used: best thermal management and less cpu throttling
Behavior 2: Radeon GPU “partially loaded” (10 watt): still decent thermal management , medium cpu throttling
Behavior 3: Radeon GPU “fully loaded” (20 watt): high cpu throttling
It seems that the Radeon GPU usage (and then, the heat and the throttling) is impacted by:
the usage of the internal display only (in this case, Radeon GPU is not used) causes Behavior 1, so best performances and less cpu throttling
the usage of *only one* display, with the lid closed, and a resolution of 4K or FullHD, causes Behavior 2 (medium throttling)
the usage of more than one display *or* a resolution different from 4K or FullHD (in my tests I used 2560 x 1440) causes Behavior 3, with the high cpu throttling
Other thoughts:
it seems that opening the lid can improve a little bit the thermal management only when more than one display is used. Opening it when only one display is used, adds a second display, the Radeon goes in “Behavior 3” and the overall situation get worst
So What?
For the best performance, use your MacBook Pro *without ANY External display, use the integrated display only*.
If you need an external display, the best trade-off is with:
only one external display
lid closed
resolution of 4K or 1080p
The worst performance are when:
you use more than one display (two external or one external + integrated)
you use a different resolution than 4K or 1080p (need to do more tests with different resolutions, I only tested 2560 x 1440 by now)
Let me know in the comment if you have any question or you have made similar tests with different results.
Nei giorni scorsi ho dovuto analizzare i sistemi di sicurezza implementati in un’App iOS/Android.
L’App – di cui ho tolto i riferimenti per rispettare NDA – permette a utenti registrati di interagire tra loro inviandosi messaggi privati, file, videochiamate, e il mio scopo era capire il livello di sicurezza delle informazioni degli utenti:
Può un utente accedere alle informazioni (dati personali, contenuti, media) di altri?
È possibile leggere o eseguire dump dei dati presenti nel backend?
È possibile eseguire azioni per conto di altri utenti, scavalcando il sistema di permessi?
In questo articolo vi voglio raccontare della procedura utilizzata, che per forza di cose non sarà identica per tutte le App che analizzerete, ma può:
essere un punto di partenza per capire come muovervi 🙂
fare da vademecum sugli strumenti da utilizzare
darvi qualche “insight” su cosa cercare e dove
Tornando a noi, mi sono quindi focalizzato sull’analisi dei protocolli usati dall’app, e il primo step è stato quello di un Man In The Middle attack per sniffare il traffico tra app e backend.
Per fare questo, ho utilizzato:
Uno smartphone Android * (vedi note)
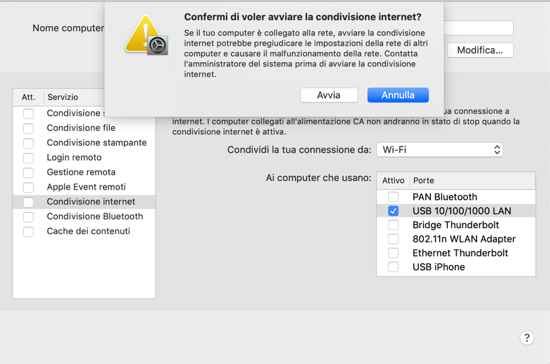
Il mio Mac, utilizzato in questo caso come router abilitando la Condivisione internet. La scheda wifi utilizzata come “Access Point” a cui collegare lo smartphone Android, e la rete cablata come WAN.
Sono principalmente un Mac e iOS user, infatti i primi test sull’app li ho fatti tramite iOS. Tuttavia, su iOS è molto complicato decompilare un’app: tutte le app disponibili su Apple Store sono cifrate, e le chiavi di crittografia sono conservate nei secure enclave di iPhone/iPad. L’unico modo per decompilare un’app iOS è quindi avere il sorgente decrittato – recuperabile tramite un dump diretto dalla memoria di iOS, procedura possibile solo su iPhone Jailbroken.
BURP SUITE
Imposteremo Burp Suite per un man in the middle attack, se sai già come impostarlo puoi saltare questo paragrafo
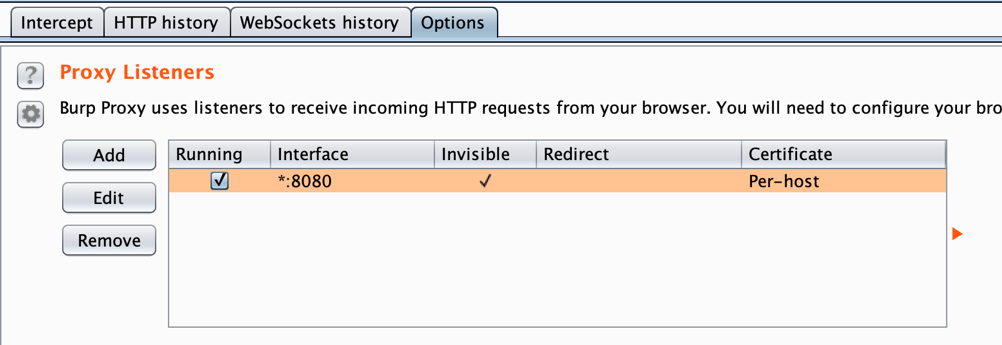
Burp Suite permette di attivare un proxy solo su porte specifiche, e non su un range-wildcard.
Va configurato come da seguente immagine, quindi port 8080, bind to all interfaces, “invisible” e “per-host” certificate
Burp Suite Proxy
Per ovviare al discorso delle porte e non creare decine di regole, ho modificato il file /etc/pf.conf del mio Mac come segue
scrub-anchor "com.apple/*"
nat-anchor "com.apple/*"
rdr-anchor "com.apple/*"
rdr on bridge100 inet proto tcp to any port 1:65535 -> 127.0.0.1 port 8080
dummynet-anchor "com.apple/*"
anchor "com.apple/*"
load anchor "com.apple" from "/etc/pf.anchors/com.apple"
La riga incriminata è quella in grassetto, e praticamente dice: su bridge100 (l’interfaccia di rete che viene creata attivando la Condivisione Internet), tutti i pacchetti tcp che vengono ricevuti su tutte le porte – range 1:65535 – devono essere ruotati su localhost alla porta 8080 (quella che usiamo su Burp Suite come proxy)
A questo punto possiamo dare un:
sudo pfctl -f /etc/pf.conf
sudo pfctl -e
per ricaricare le regole di packet filtering e rendere attivo il file appena modificato.
Rimane solo una cosa da fare: Burp Suite può fare Man In The Middle su SSL, a patto che:
ci sia pieno controllo del device target, quindi sia possibile installare un certificato Self Signed e impostarlo come trusted. In questo modo Burp Suite inietterà nelle request un suo certificato, decripterà il payload per presentarvelo in chiaro, e poi lo reencrypterà prima di inviarlo al backend, e viceversa.
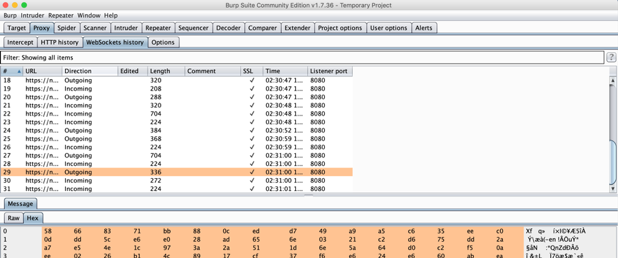
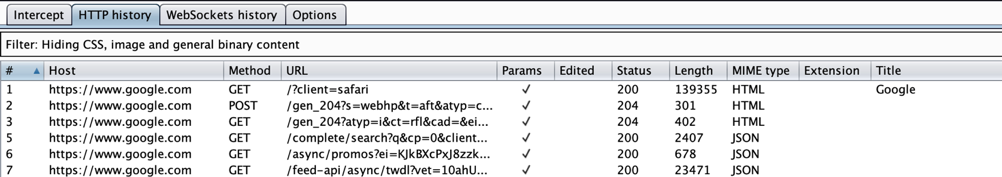
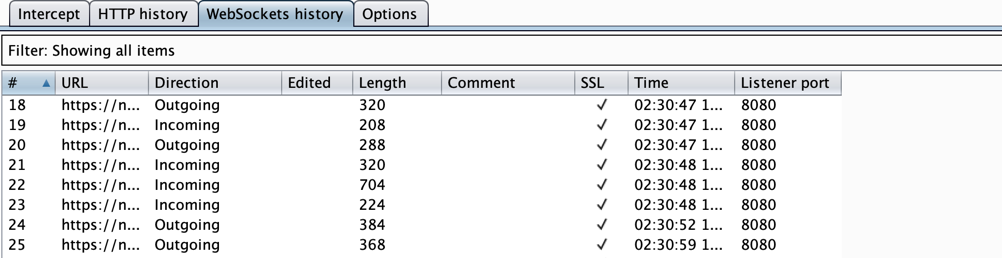
Se abbiamo fatto tutto correttamente, vedremo riempirsi la history HTTP (e nel caso dell’app che ho analizzato, anche websocket)
Burp CallsBurp Websocket
ANALISI
Dopo un po’ di di analisi dei payload transitanti su Burp Suite, ho notato che all’invio di un messaggio chat, seguivano alcuni messaggi websocket, quindi mi sono focalizzato su quelli.
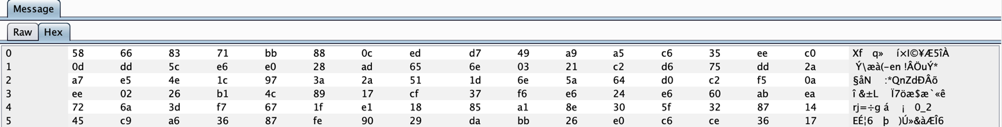
Peccato che l’output fosse incomprensibile
Output
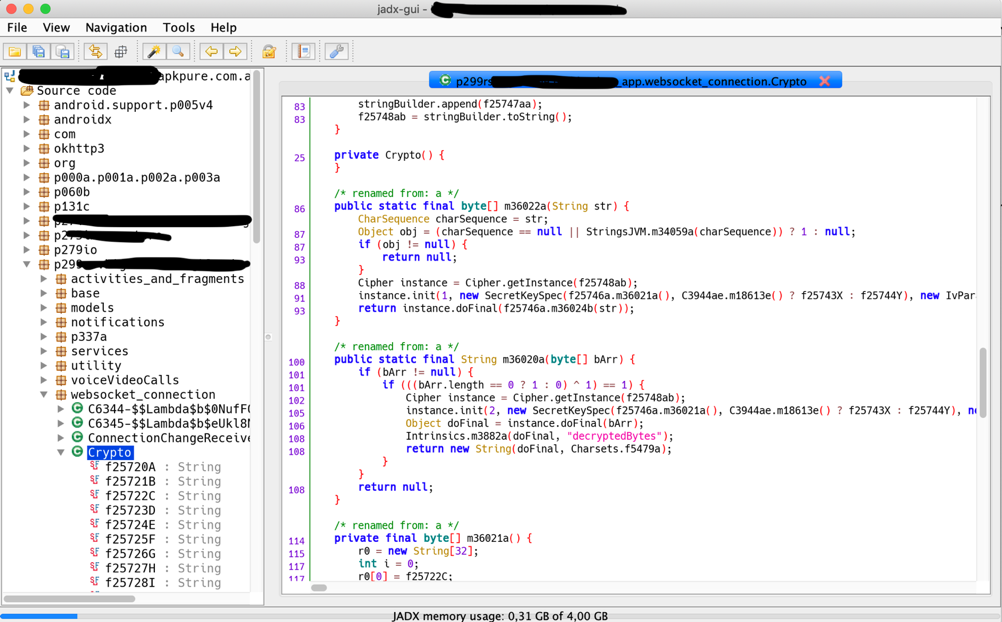
Per questo motivo, dopo un po’ di tentativi di “deoffuscamento”, ho cambiato strategia e mi sono focalizzato sul decompilare l’APK.
questi JSON vengono a inviati passati alla funzione di encrypt che restituisce un array di bytes
vengono inviati all’Application Server tramite Websocket binario
E, in ingresso, il flusso è al contrario.
A questo punto, chiarito il flusso, ho cercato di capire:
– il tipo di encryption usata
– le chiavi di cifratura
Problema: le variabili di istanza sono parzialmente offuscate, per colpa di Kotlin ( https://kotlinlang.org ).
Non conosco a fondo l’ecosistema Android, ma ho capito che si tratta di un linguaggio nativo che sta diventando lo standard de facto su Android, e che compila binari Java-compatibili.
Per questo motivo riusciamo a decompilare qualcosa che somiglia a Java, ma che ha delle “stranezze”
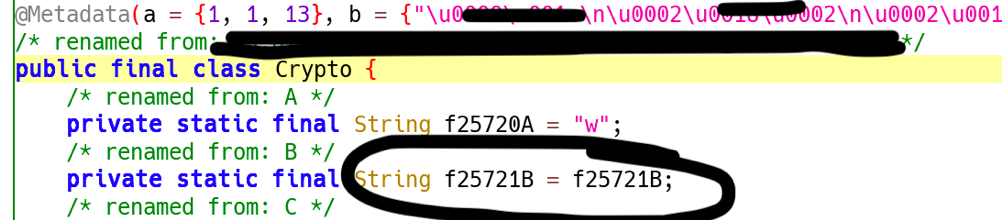
Metadata
Per esempio, l’annotation @Metadata contiene un sacco di dati encodati che poi vengono utilizzati a runtime per popolare le variabili di istanza statiche che ho cerchiato.
In Java f25721B = f25721B non significa nulla, ma il vero valore della static String f25721B è in quei metadata, di cui ho trovato pochissima documentazione.
Purtroppo, però, non sono riuscito a trovare un decompilatore Kotlin, quindi ho proseguito con le mie indagini seguendo altre strade.
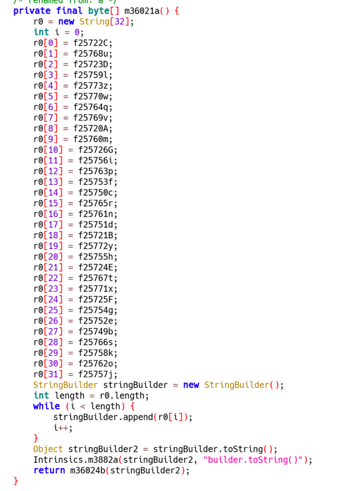
instance.init(1, new SecretKeySpec(f25746a.m36021a(), C3944ae.m18613e() ? f25743X : f25744Y), new IvParameterSpec(f25746a.m36023b()));
AESIV
Analizzando la signature del metodo init di Cypher e del constructor di IvParameterSpec(), ho capito che si tratta dei metodi che generano le chiavi di crittografia.
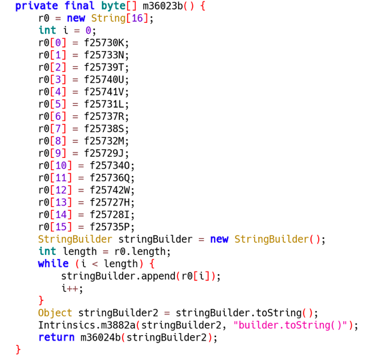
In particolare, recuperano rispettivamente 32 e 16 variabili di istanza e le accodano una a una fino a formare una chiave.
Altro problema, le variabili referenziate sono quelle viste poco sopra:
Variables
e quindi siamo nuovamente a un punto morto, non abbiamo accesso ai byte che compongono le chiavi di crittografia.
Decido quindi di indagare ulteriormente su Kotlin, e scopro che il processo di decompilazione fatto da Jadx, prevede vari passaggi intermedi, tra cui l’estrazione del bytecode dell’applicazione prima di decompilarla.
Mi chiedo quindi…che succede se frugo nel bytecode?
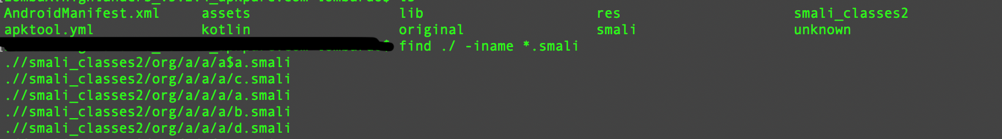
Per estrarlo, uso apktool:
apktool d nome_app.apk
che spacchetta l’apk in una directory contenente diversi file con varie estensioni, tra cui dei file con estensione *.smali che sono quelli contenenti il bytecode dell’app.
Smali
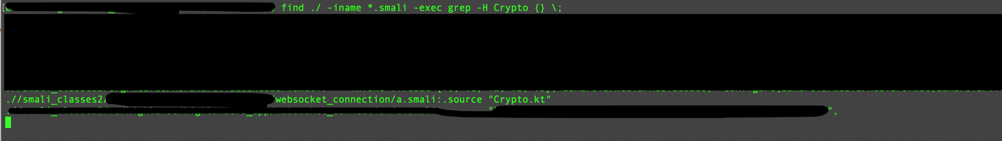
Decido quindi di cercare in tutti i file la stringa Crypto, il nome della classe su cui sto lavorando:
find ./ -iname *.smali -exec grep -H Crypto {} \;
Smali2
e trovo un file a.smali che contiene alcune info interessanti:
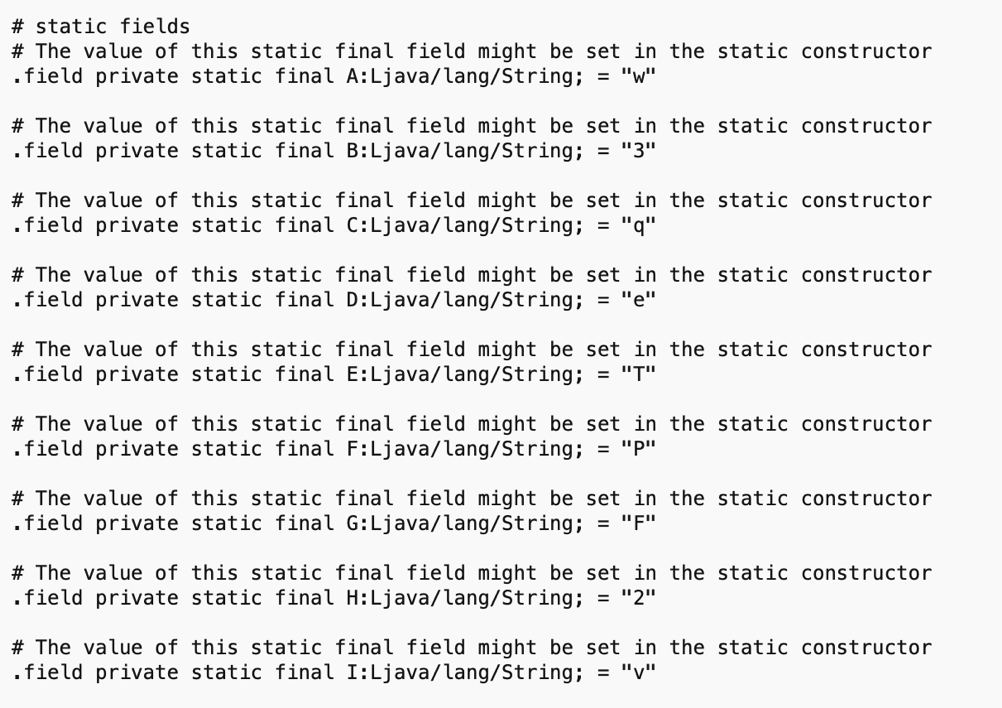
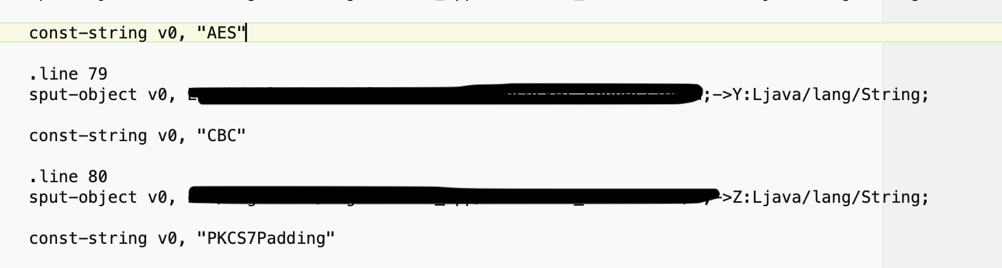
Una serie di stringhe statiche, di 1 singolo carattere ciascuna. E sono 48 (32 + 16), quelle che cercavo!
Static Fields
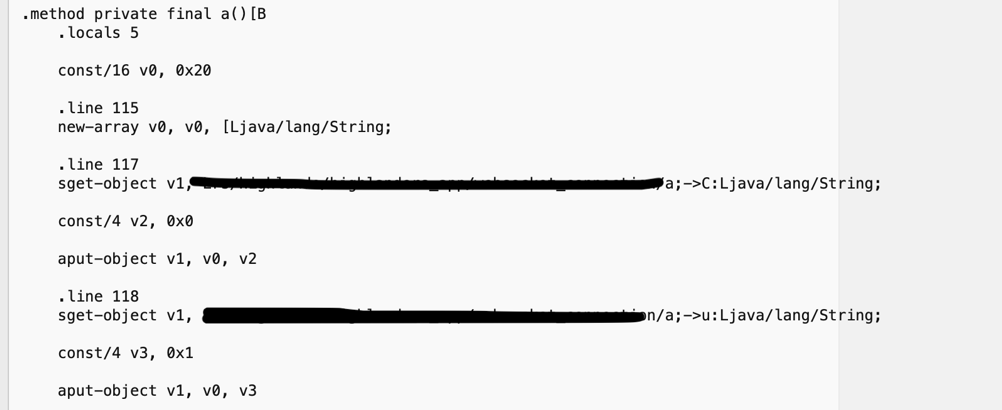
Il bytecode dei metodi che ho mostrato poco più sopra, quelli che generano la key.
Smali3
In questo modo ho:
il contenuto di 48 variabili di istanza (32 + 16)
i dettagli delle assegnazioni, mi spiego meglio:
alla riga 115 vediamo che viene generato l’array vuoto
alla riga 117, viene assegnata la prima variabile, che è ->C
alla riga 118, viene assegnata la seconda, che è ->u
e così via
Se torniamo al primo elenco, vedremo che alla lettera C (maiuscola) corrisponde la seguente static var:
che contiene la lettera “q”.
Nel restante bytecode sono anche riuscito a trovare i dettagli dell’encryption usata:
AES
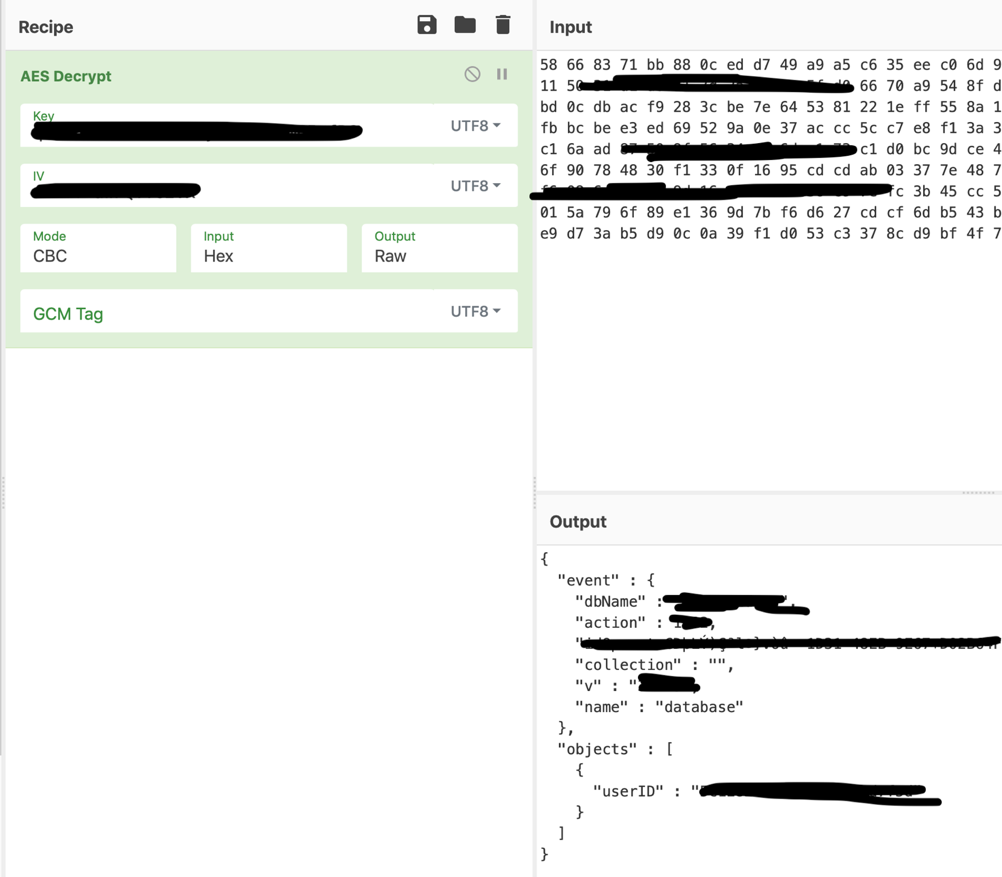
Mi è bastato quindi ricostruire la chiave con il metodo precedente, e tramite quest’ottimo tool online leggere finalmente il payload del messaggio websocket: https://gchq.github.io/CyberChef
Questa specifica app analizzata non utilizza altri metodi di autenticazione e autorizzazione “per user”, quindi la decodifica dei payload permette cose interessanti. I payload possono essere quindi intercettati, modificati e reinviati al backend, eseguendo azioni per conto di altri utenti.
Non è lo scopo di questo post consigliare sugli adeguati metodi di protezione da implementare nelle vostre app, questi metodi dipendono fortemente dalla tipologia di app trattata, ma provo a riassumere alcuni punti fermi:
Se la vostra app lavora con dati di utenti (quindi esiste una procedura di login), non reinventate la ruota e usate degli standard. Dopo il login, rilasciate all’utente un token (ad esempio un bel token JWT https://jwt.io ) e utilizzatelo per autorizzare ogni singola chiamata. Una cosa del genere:
Il vostro backend dovrà accettare solo request effettuate con token validi e firmati, inoltre dovrà verificare che le azioni richieste dal payload siano permesse all’utente “proprietario” del token.
Il token può essere comunque letto tramite un attacco MITM come quello che abbiamo appena fatto, ma sarà “per user”, quindi un eventuale attaccante potrà solo fare chiamate con token a lui assegnati (quindi sarà identificabile), e solo azioni che il backend gli permette.
Inoltre, è vero che il token JWT è un normale base64, quindi il suo contenuto leggibile, ma non può essere alterato senza conoscere la sua chiave (in caso di alterazione la sua firma non sarebbe più valida)
Nota importante: il token JWT va generato (“staccato”) direttamente dal backend, e non va generato dall’app, altrimenti siamo punto e a capo, perchè significa che in qualche modo la chiave JWT sarà nota all’app.
Non affidatevi esclusivamente all’approccio “Security through obscurity”. Se mettete tutta la logica applicativa, inclusa la validazione e l’autorizzazione, direttamente nell’app client, praticamente state lasciando a un attaccante le chiavi di casa vostra, sono solo nascoste. Magari per l’attaccante sarà difficile scoprire dove nascondete le chiavi, ma con sufficiente pazienza riuscirà a trovarle. (e tipicamente, a meno che non siate un’azienda che investe davvero *tanto* in sicurezza, avrà più tempo e pazienza di voi). Spostate le logiche su backend e trattate le app, anche se fatte al 100% da voi, come oggetti “not trusted”. Possono essere manomesse.
È tutto, fatemi sapere cosa ne pensate e se avete bisogno di altre informazioni nei commenti.
A short article to inform you that I’ve just published a proof of concept of JWT token validation with NGINX using NJS. NJS is a subset of Javascript that allows extending NGINX functionalities: https://nginx.org/en/docs/njs/
Please note: NGINX can already validate JWT Tokens, but only if you pay for the Plus subscription. Thanks to NJS we can now validate JWT Tokens with the free version of NGINX.
In this article we’ll take a look at the performance cost (or “overhead”) of using AWS Lambda@Edge ( https://aws.amazon.com/lambda/edge/ ) on a CloudFront distribution.
Note: In this article I won’t explain how to create these resources (you can find detailed instructions on the official AWS pages), but I want to focus on the test cases.
You can use Lambda@Edge to execute arbitrary Lambda Functions on your requests, for example to authenticate an user through a JSON Web Token ( https://jwt.io ) before routing them to a static asset.
The main advantage of Lambda@Edge is that the code (Javascript) is executed “near to the edge”, so really clouse to the edge location, and so with a small performance cost.
So, for testing this:
I created an S3 bucket with two files: a sample image (124KB) and an empty txt file
I created two CloudFront distributions pointing to the same bucket, one distribution triggering a Lambda@Edge function that takes the querystring and adds it in a custom header, and the other simply serving the content without further check
The first request pass through the Lambda@Edge function, so its response headers will be like these:
Content-Type: image/jpeg
…
test-header: EXAMPLEQUERYSTRING
…
X-Cache: Hit from cloudfront
As you can see, there is a `test-header` with the content of the querystring. This is unuseful in a real world situation, but we use it to understand how much is the overhead of a REALLY simple Lambda function
Since the second request doesn’t pass through the Lambda function, its header doesn’t show the custom header
Content-Type: image/jpeg
…
X-Cache: Hit from cloudfront
Finally, we are ready to test it. For the tests, I choose to use an AWS EC2 instance to minimize the networking overhead (hopefully there is a good networking between EC2 and Cloudfront) 🙂
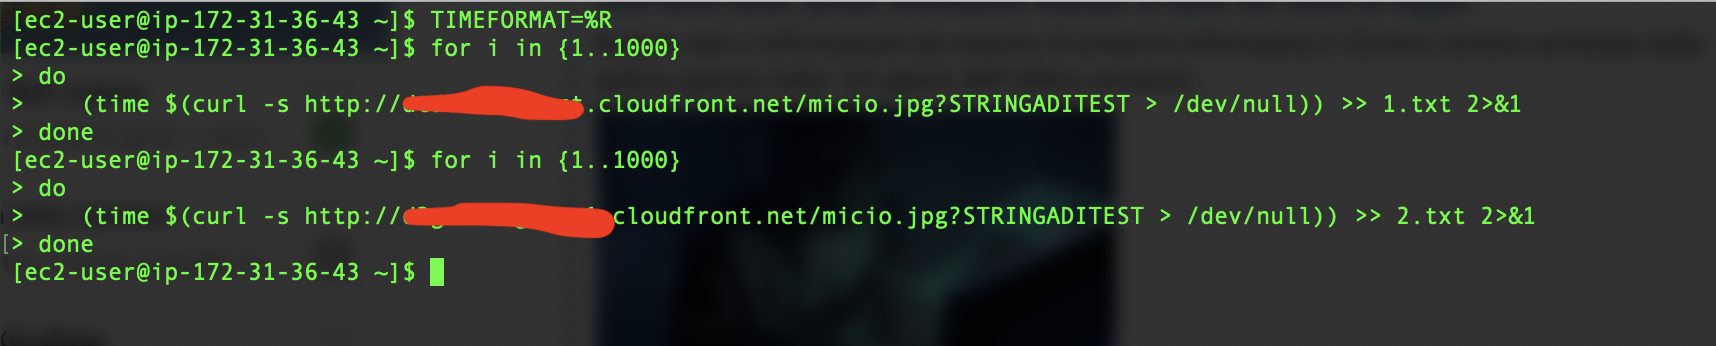
I used this simple script to collect the response times. It makes 1000 requests and adds the response time to a file:
TIMEFORMAT=%R

for i in {1..1000}
do
    (time $(curl -s http://abc.cloudfront.net/cat.jpg?EXAMPLEQUERYSTRING > /dev/null)) >> 1.txt 2>&1
done

for i in {1..1000}
do
    (time $(curl -s http://xyz.cloudfront.net/cat.jpg?EXAMPLEQUERYSTRING > /dev/null)) >> 2.txt 2>&1
done
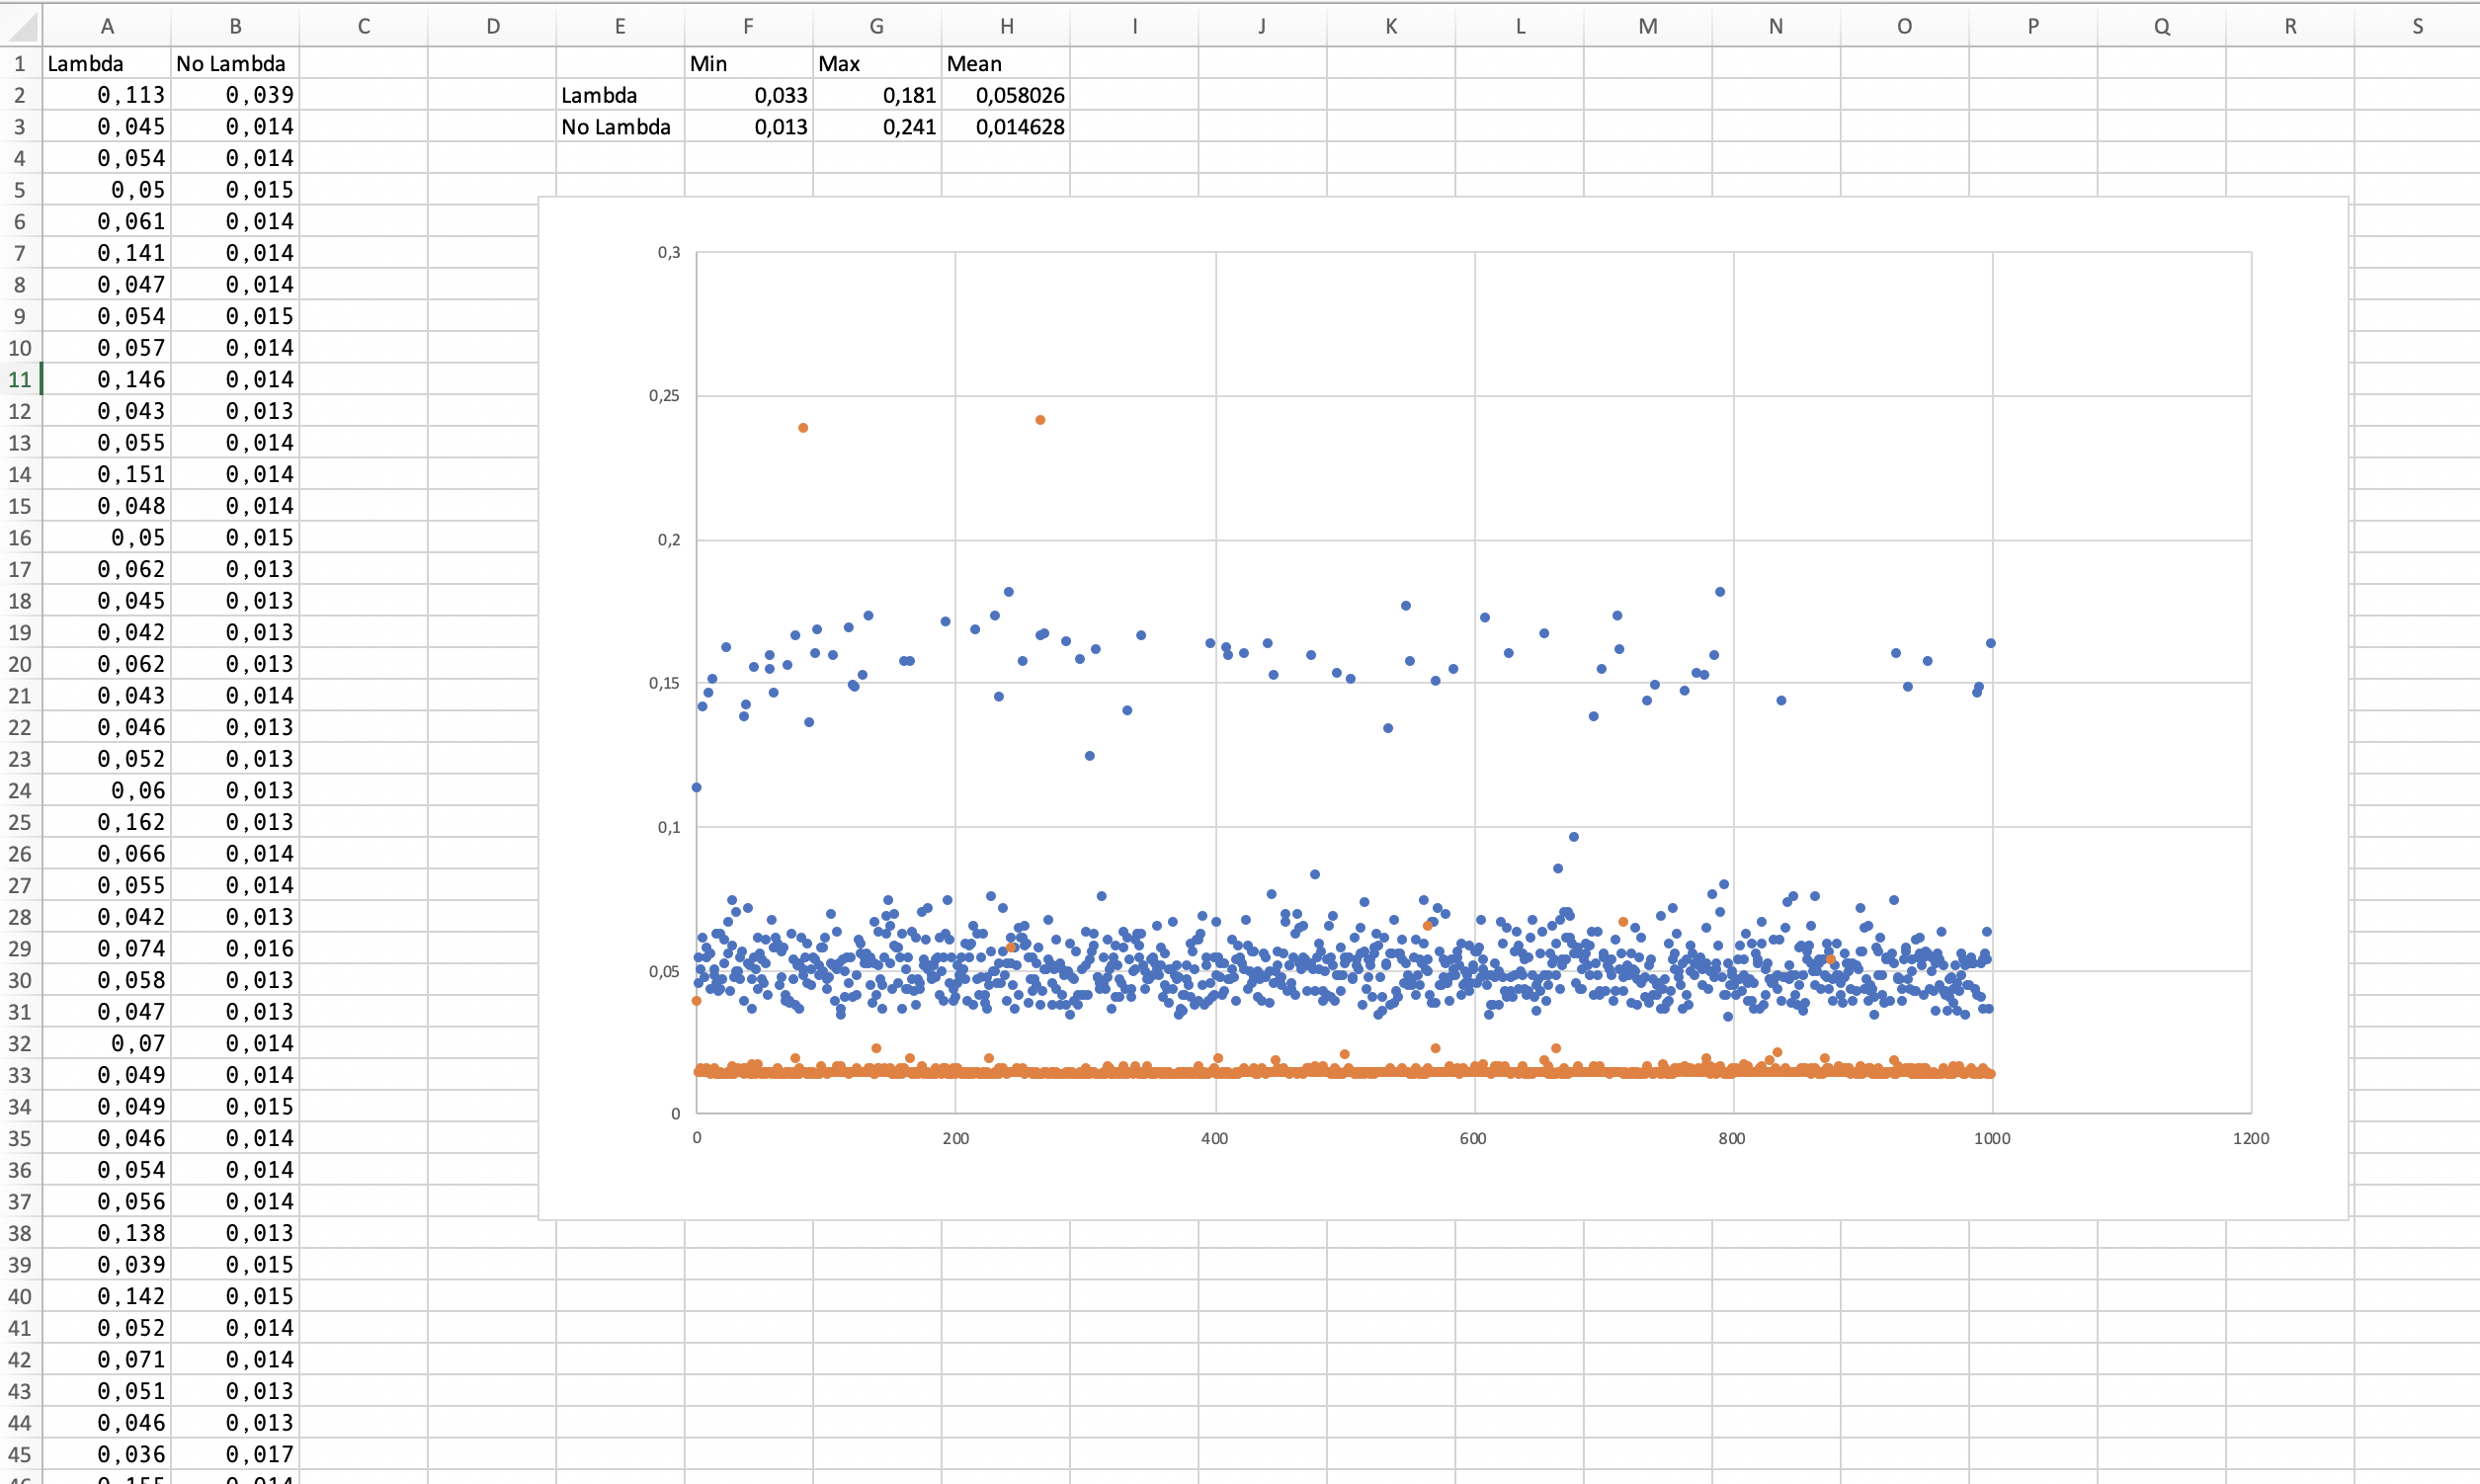
Here you can see the results:
In Orange, you see the distribution of the calls without the Lambda function, and in Blue the distribution of the calls WITH the Lambda function.
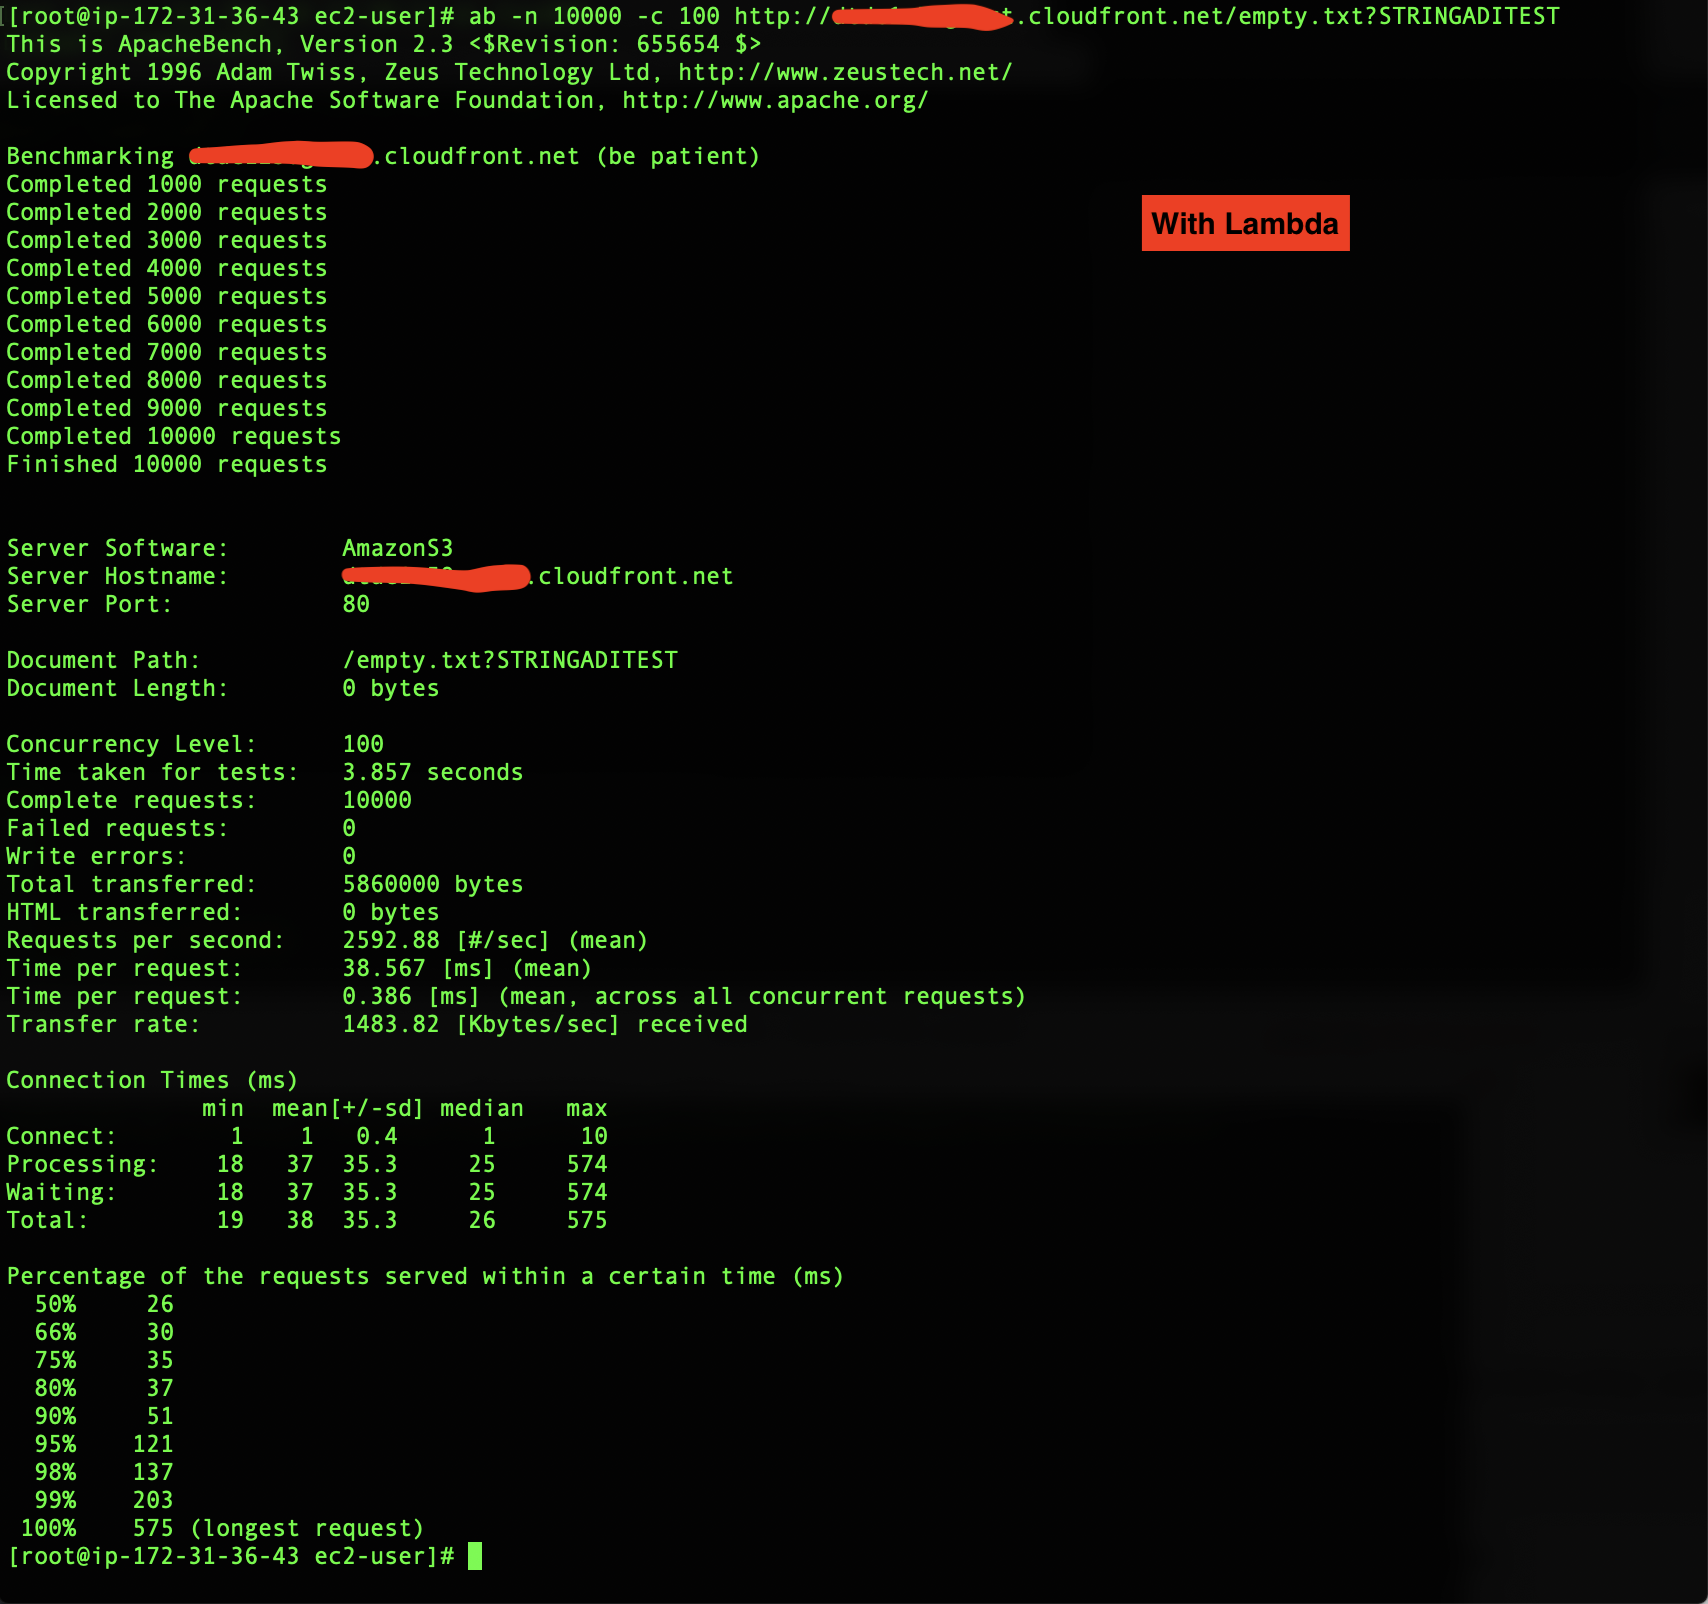
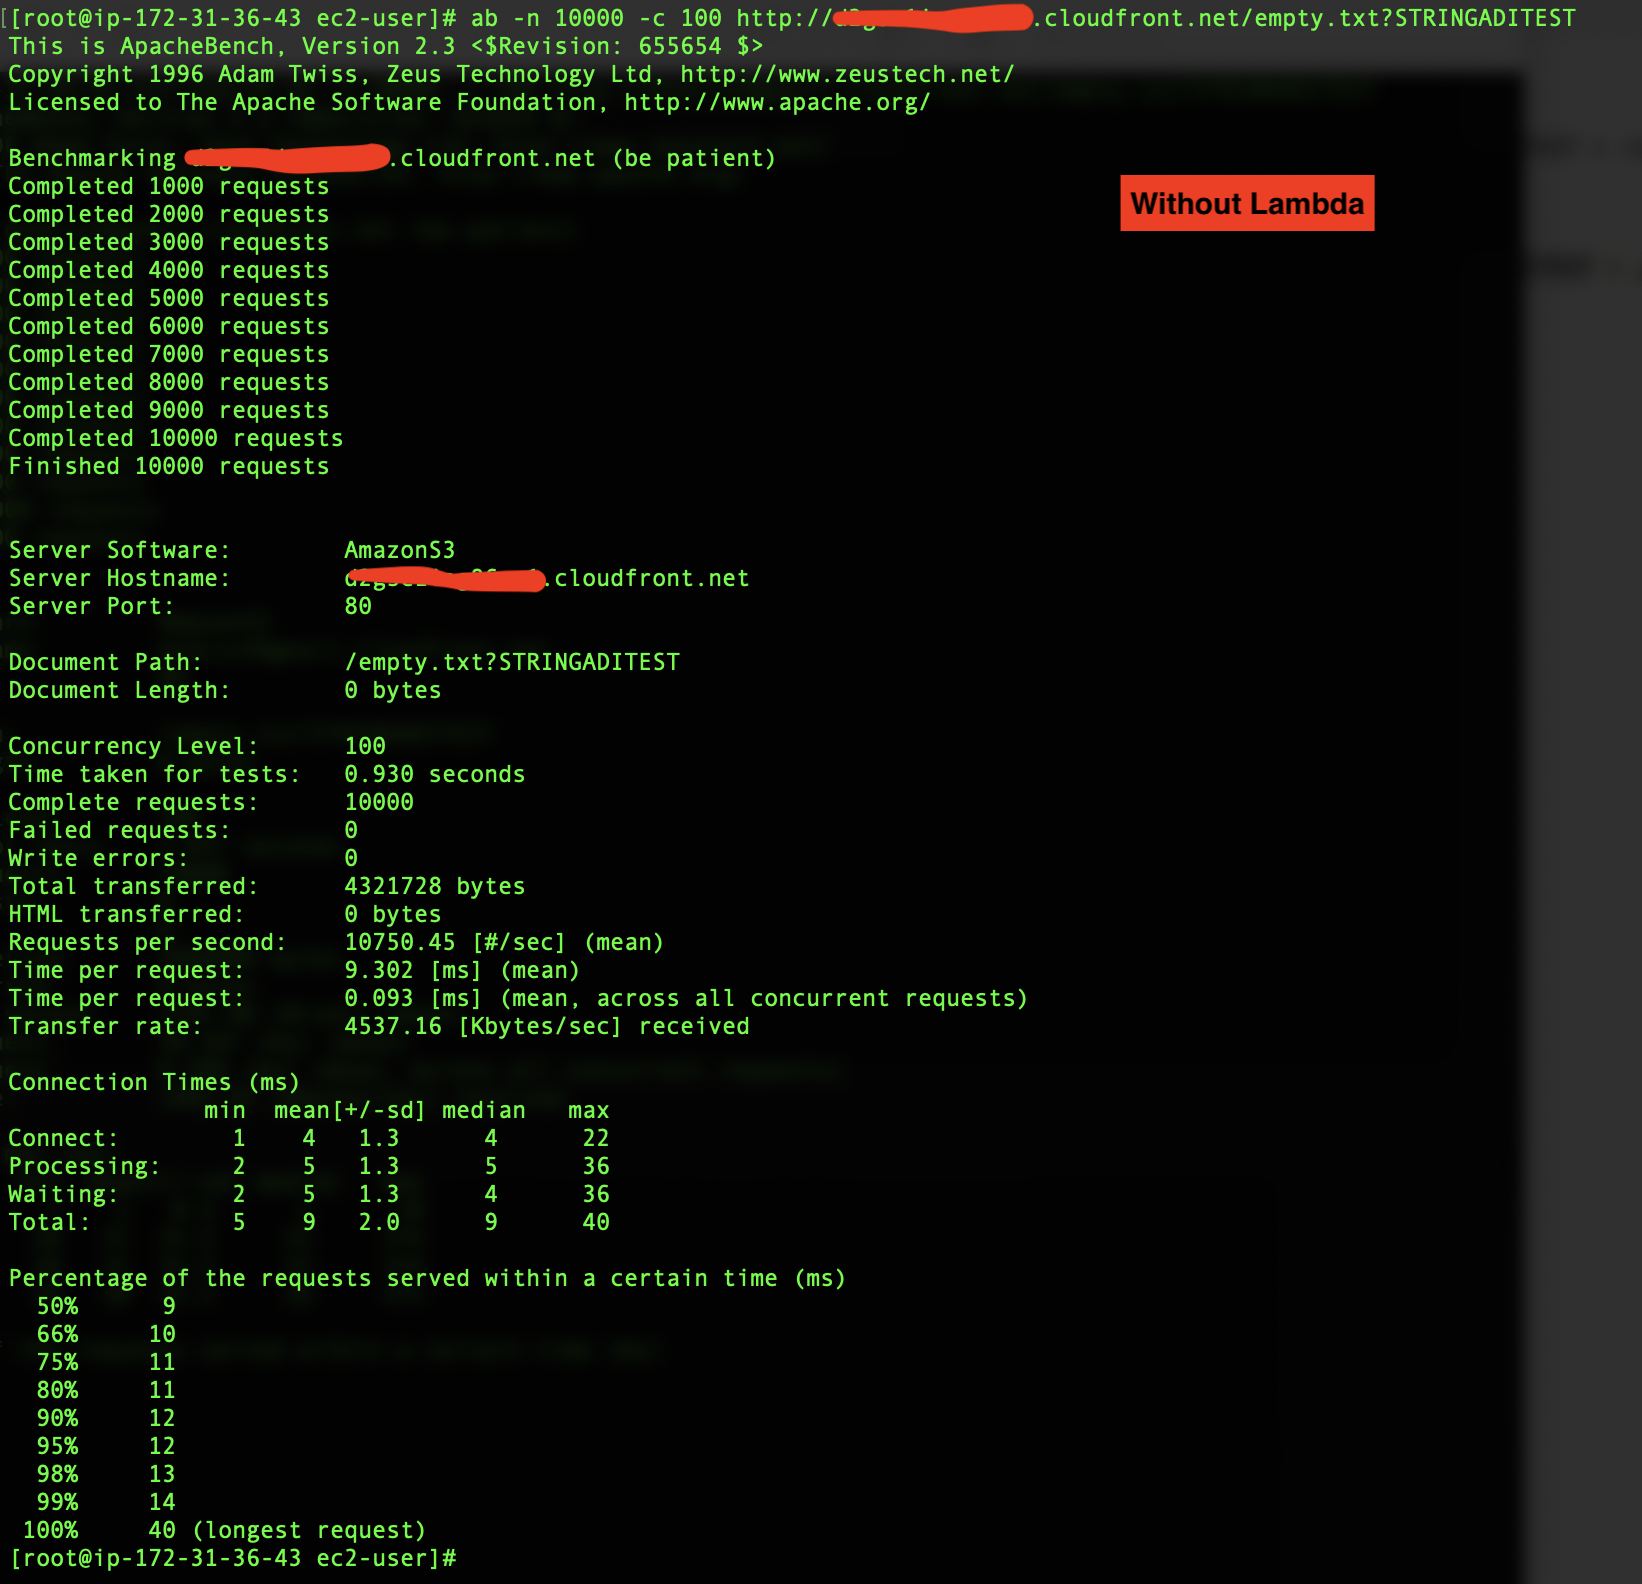
Finally, I decided to do some tests with ab (Apache Bench), in this cased I used 10.000 connections with 100 concurrent
As you can see in the Excel, there is a performance cost, since the mean moves from 0,015sec to 0,058sec. In the ab tests (with the empty.txt file), the mean moves from 9.3msec to 38.5msec. So rawly 4X.
But these timing are, in absolute, still pretty fast if we consider that they can be executed really close to the final user, and so no need to round trip to your compute-servers.
The next time I will try CloudFlare Workers, that claims to be 2X faster than AWS Lambda@Edge
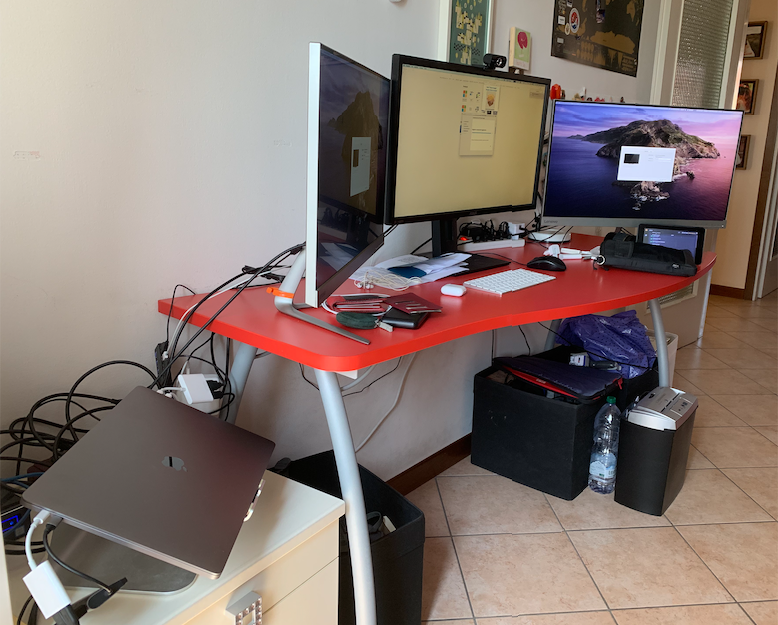
Ed eccoci arrivati al secondo appuntamento della serie #LombaXHomeLab , potete trovare gli altri articoli semplicemente cliccando sull’hashtag.
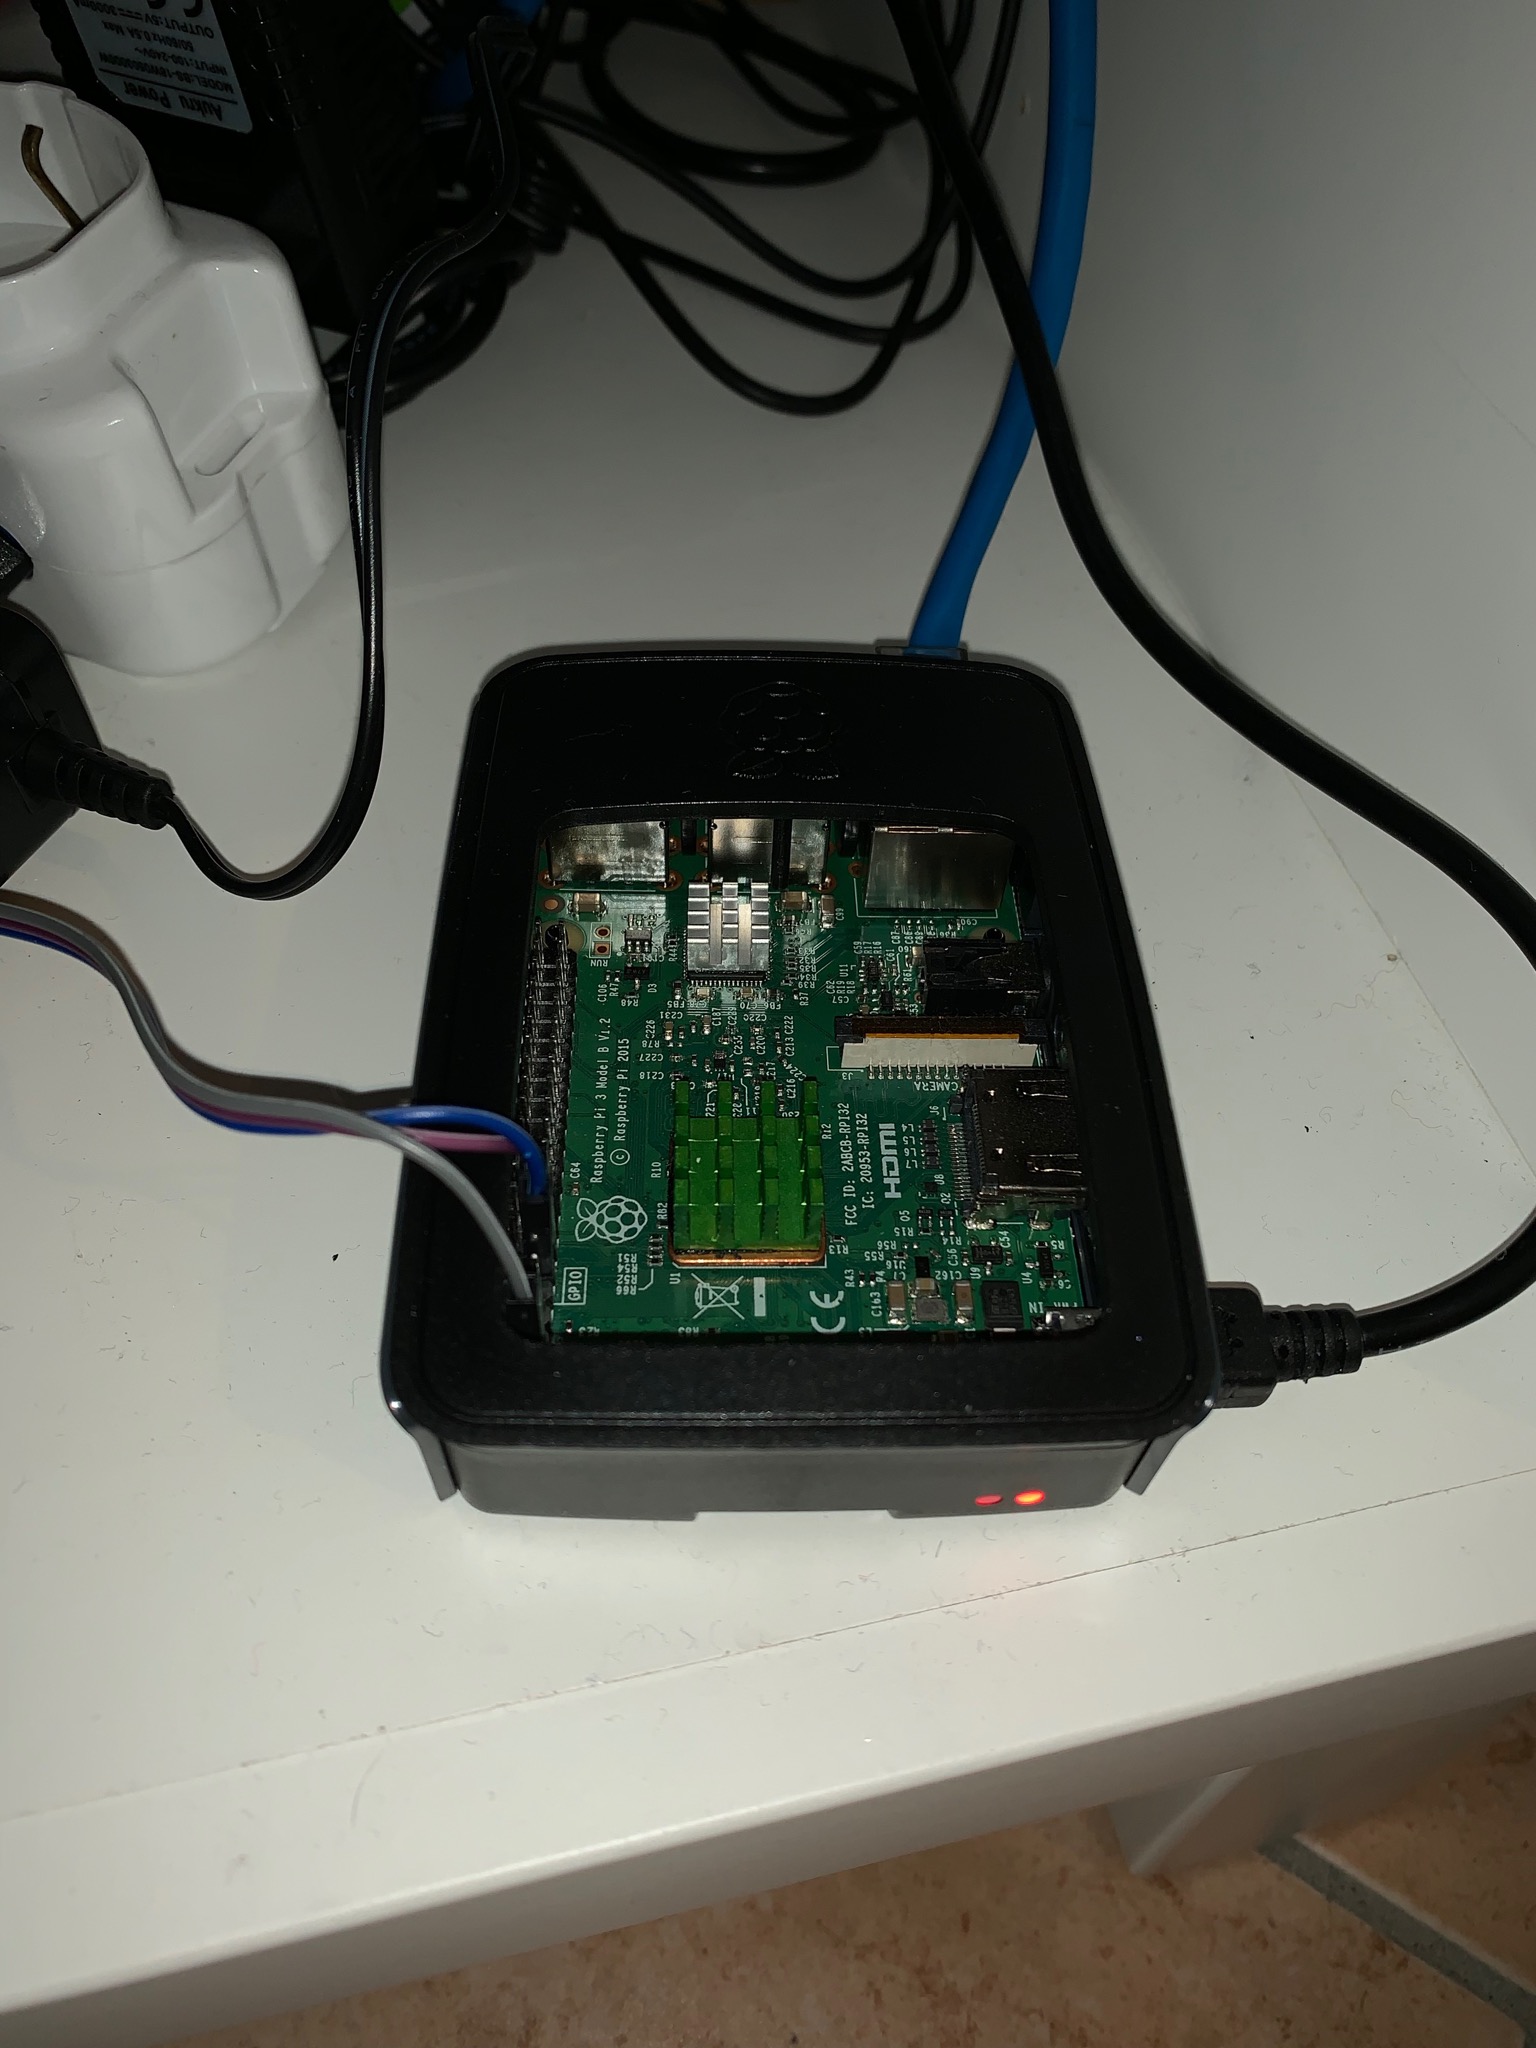
Iniziamo ad analizzare più nel dettaglio le varie componenti del mio HomeLab, ho deciso di partire da Home Assistant (o Hass, in breve), che forse è un po’ il “cuore” del progetto. Tutto è iniziato da Home Assistant, inizialmente installato su un piccolo Raspberry Pi.
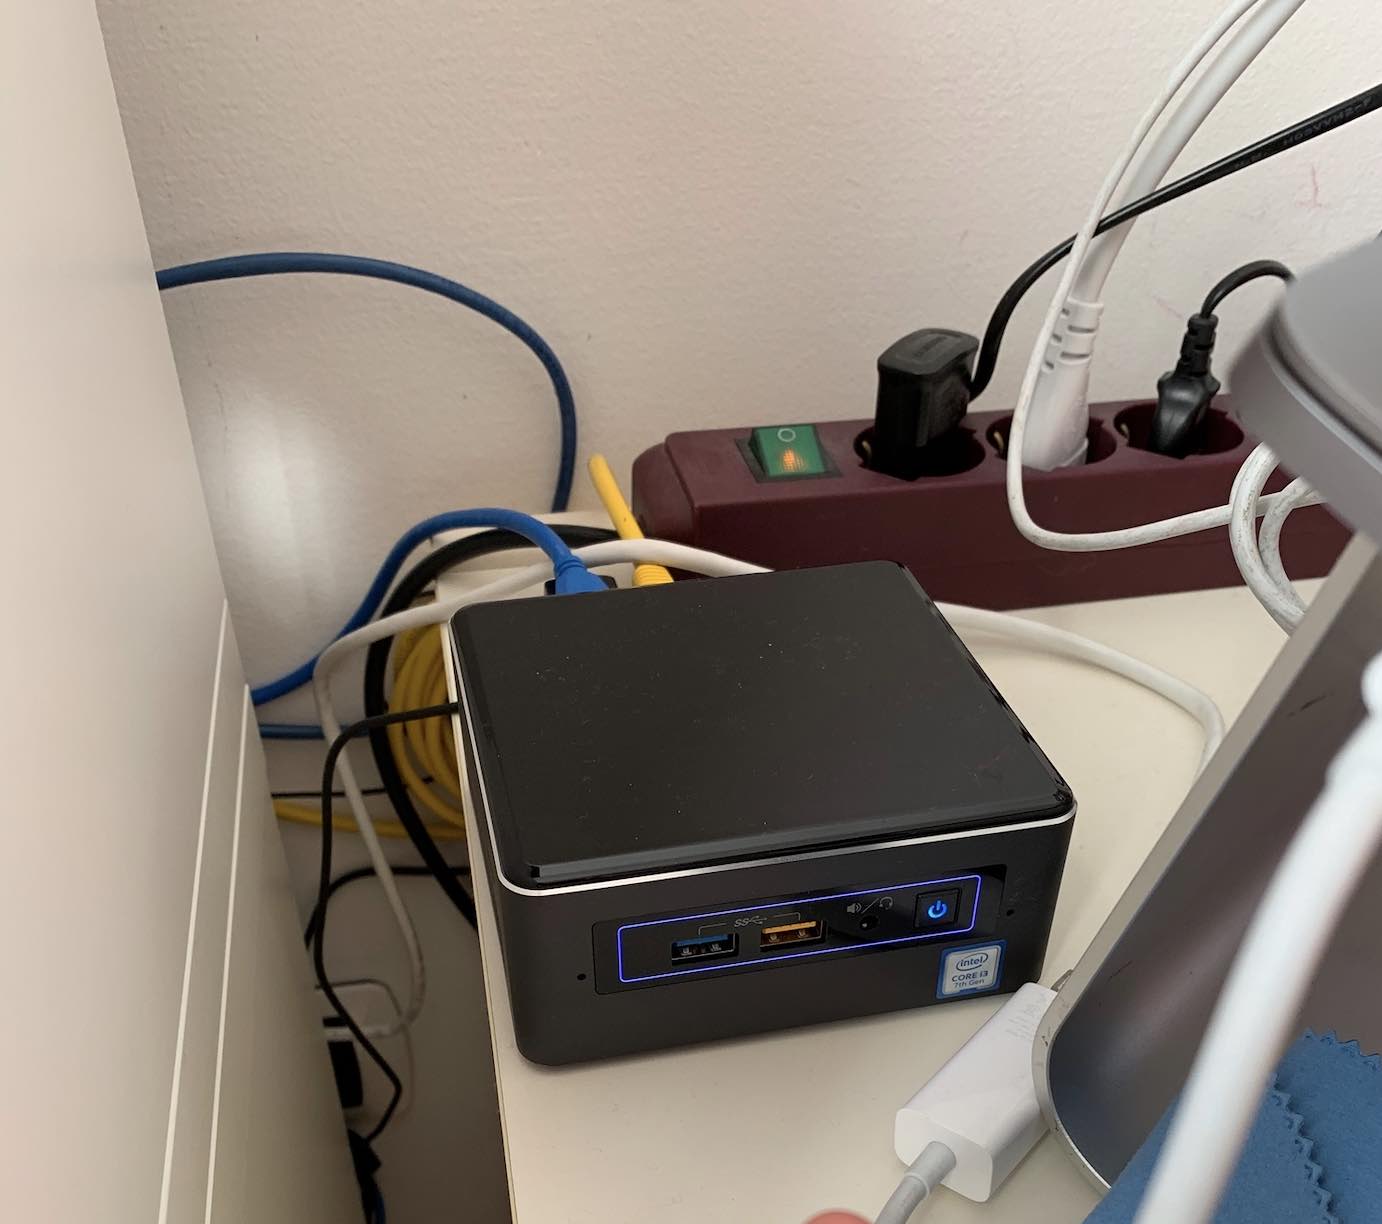
Poi, col tempo, le mie esigenze sono cambiate e ho dovuto potenziare il tutto con un Intel Nuc, ma questa è un’altra storia.
> “Open source home automation that puts local control and privacy first.“
Quindi, in poche parole, un Hub per tutti i dispositivi IoT di casa nostra, con un forte focus su controllo locale e privacy.
In questo articolo però non mi voglio focalizzare su cos’è Home Assistant o su informazioni “base” per installarlo, quindi non prendetelo come un tutorial, ma piuttosto uno stimolo alla vostra creatività. Non esitate, però, a commentare e chiedere chiarimenti qualora qualcosa non fosse chiaro.
Infine, dato che con Hass faccio tante cose, l’articolo sarebbe un po’ troppo “corposo” quindi lo spezzerò in varie puntate.
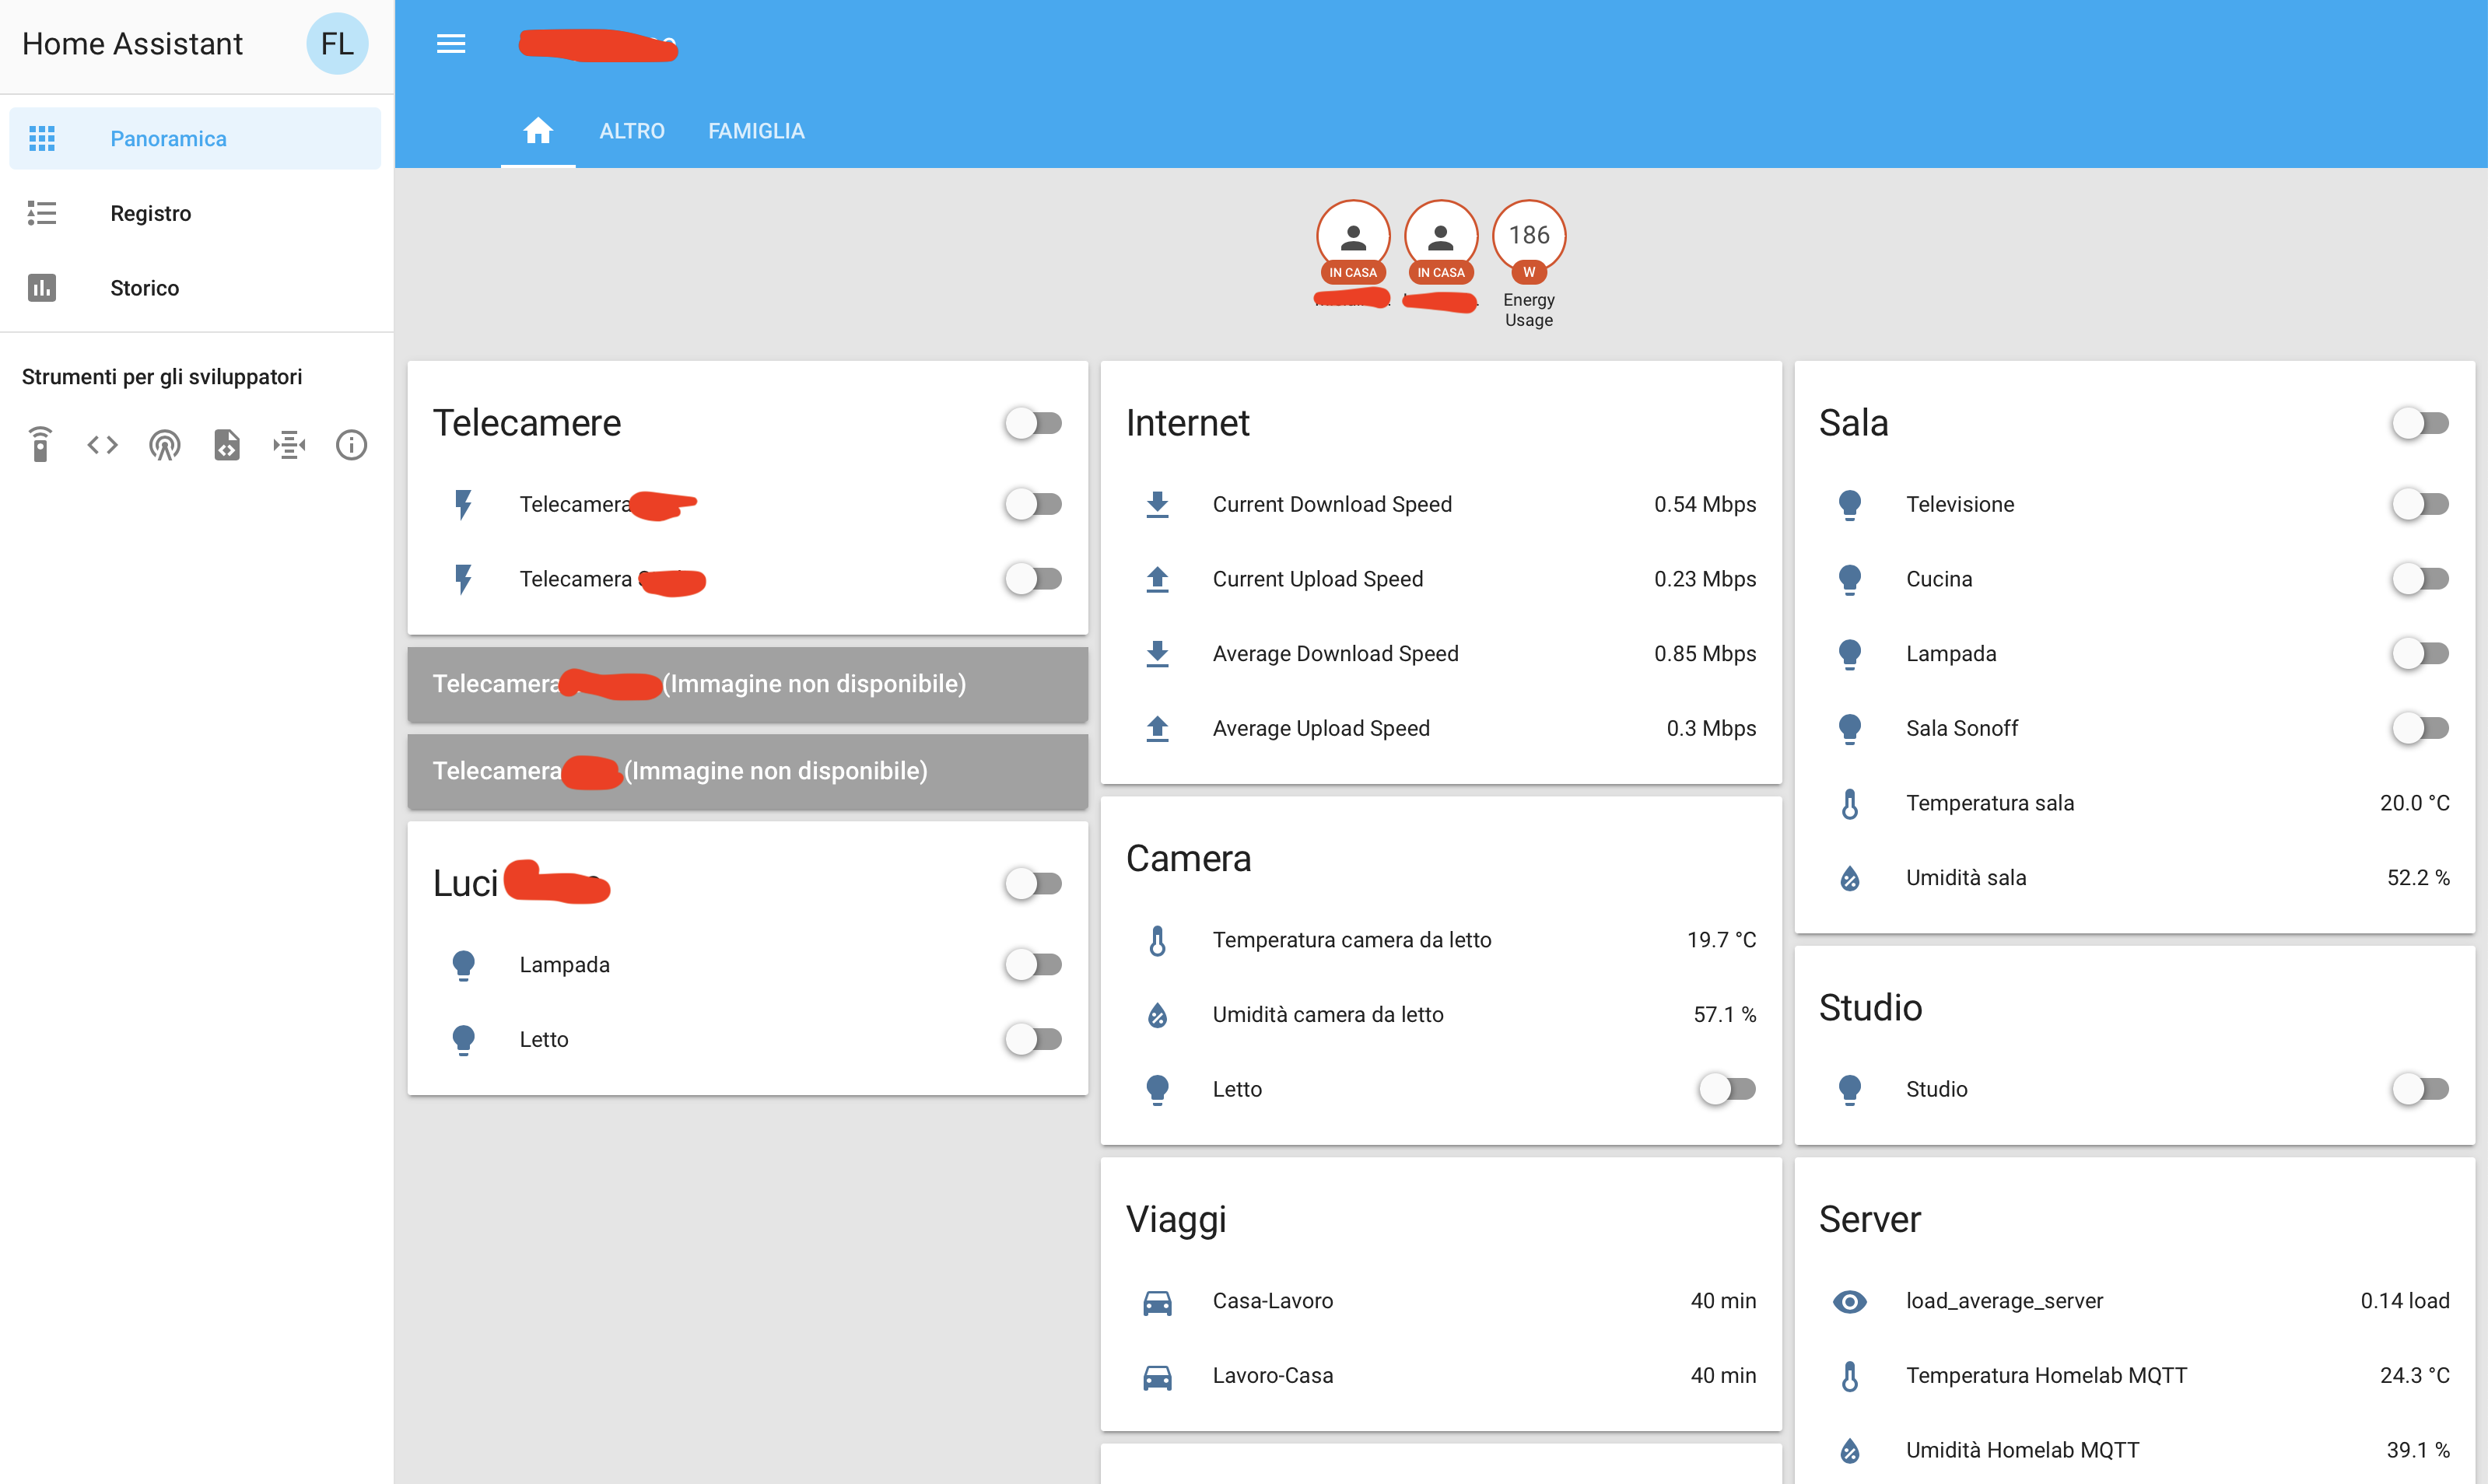
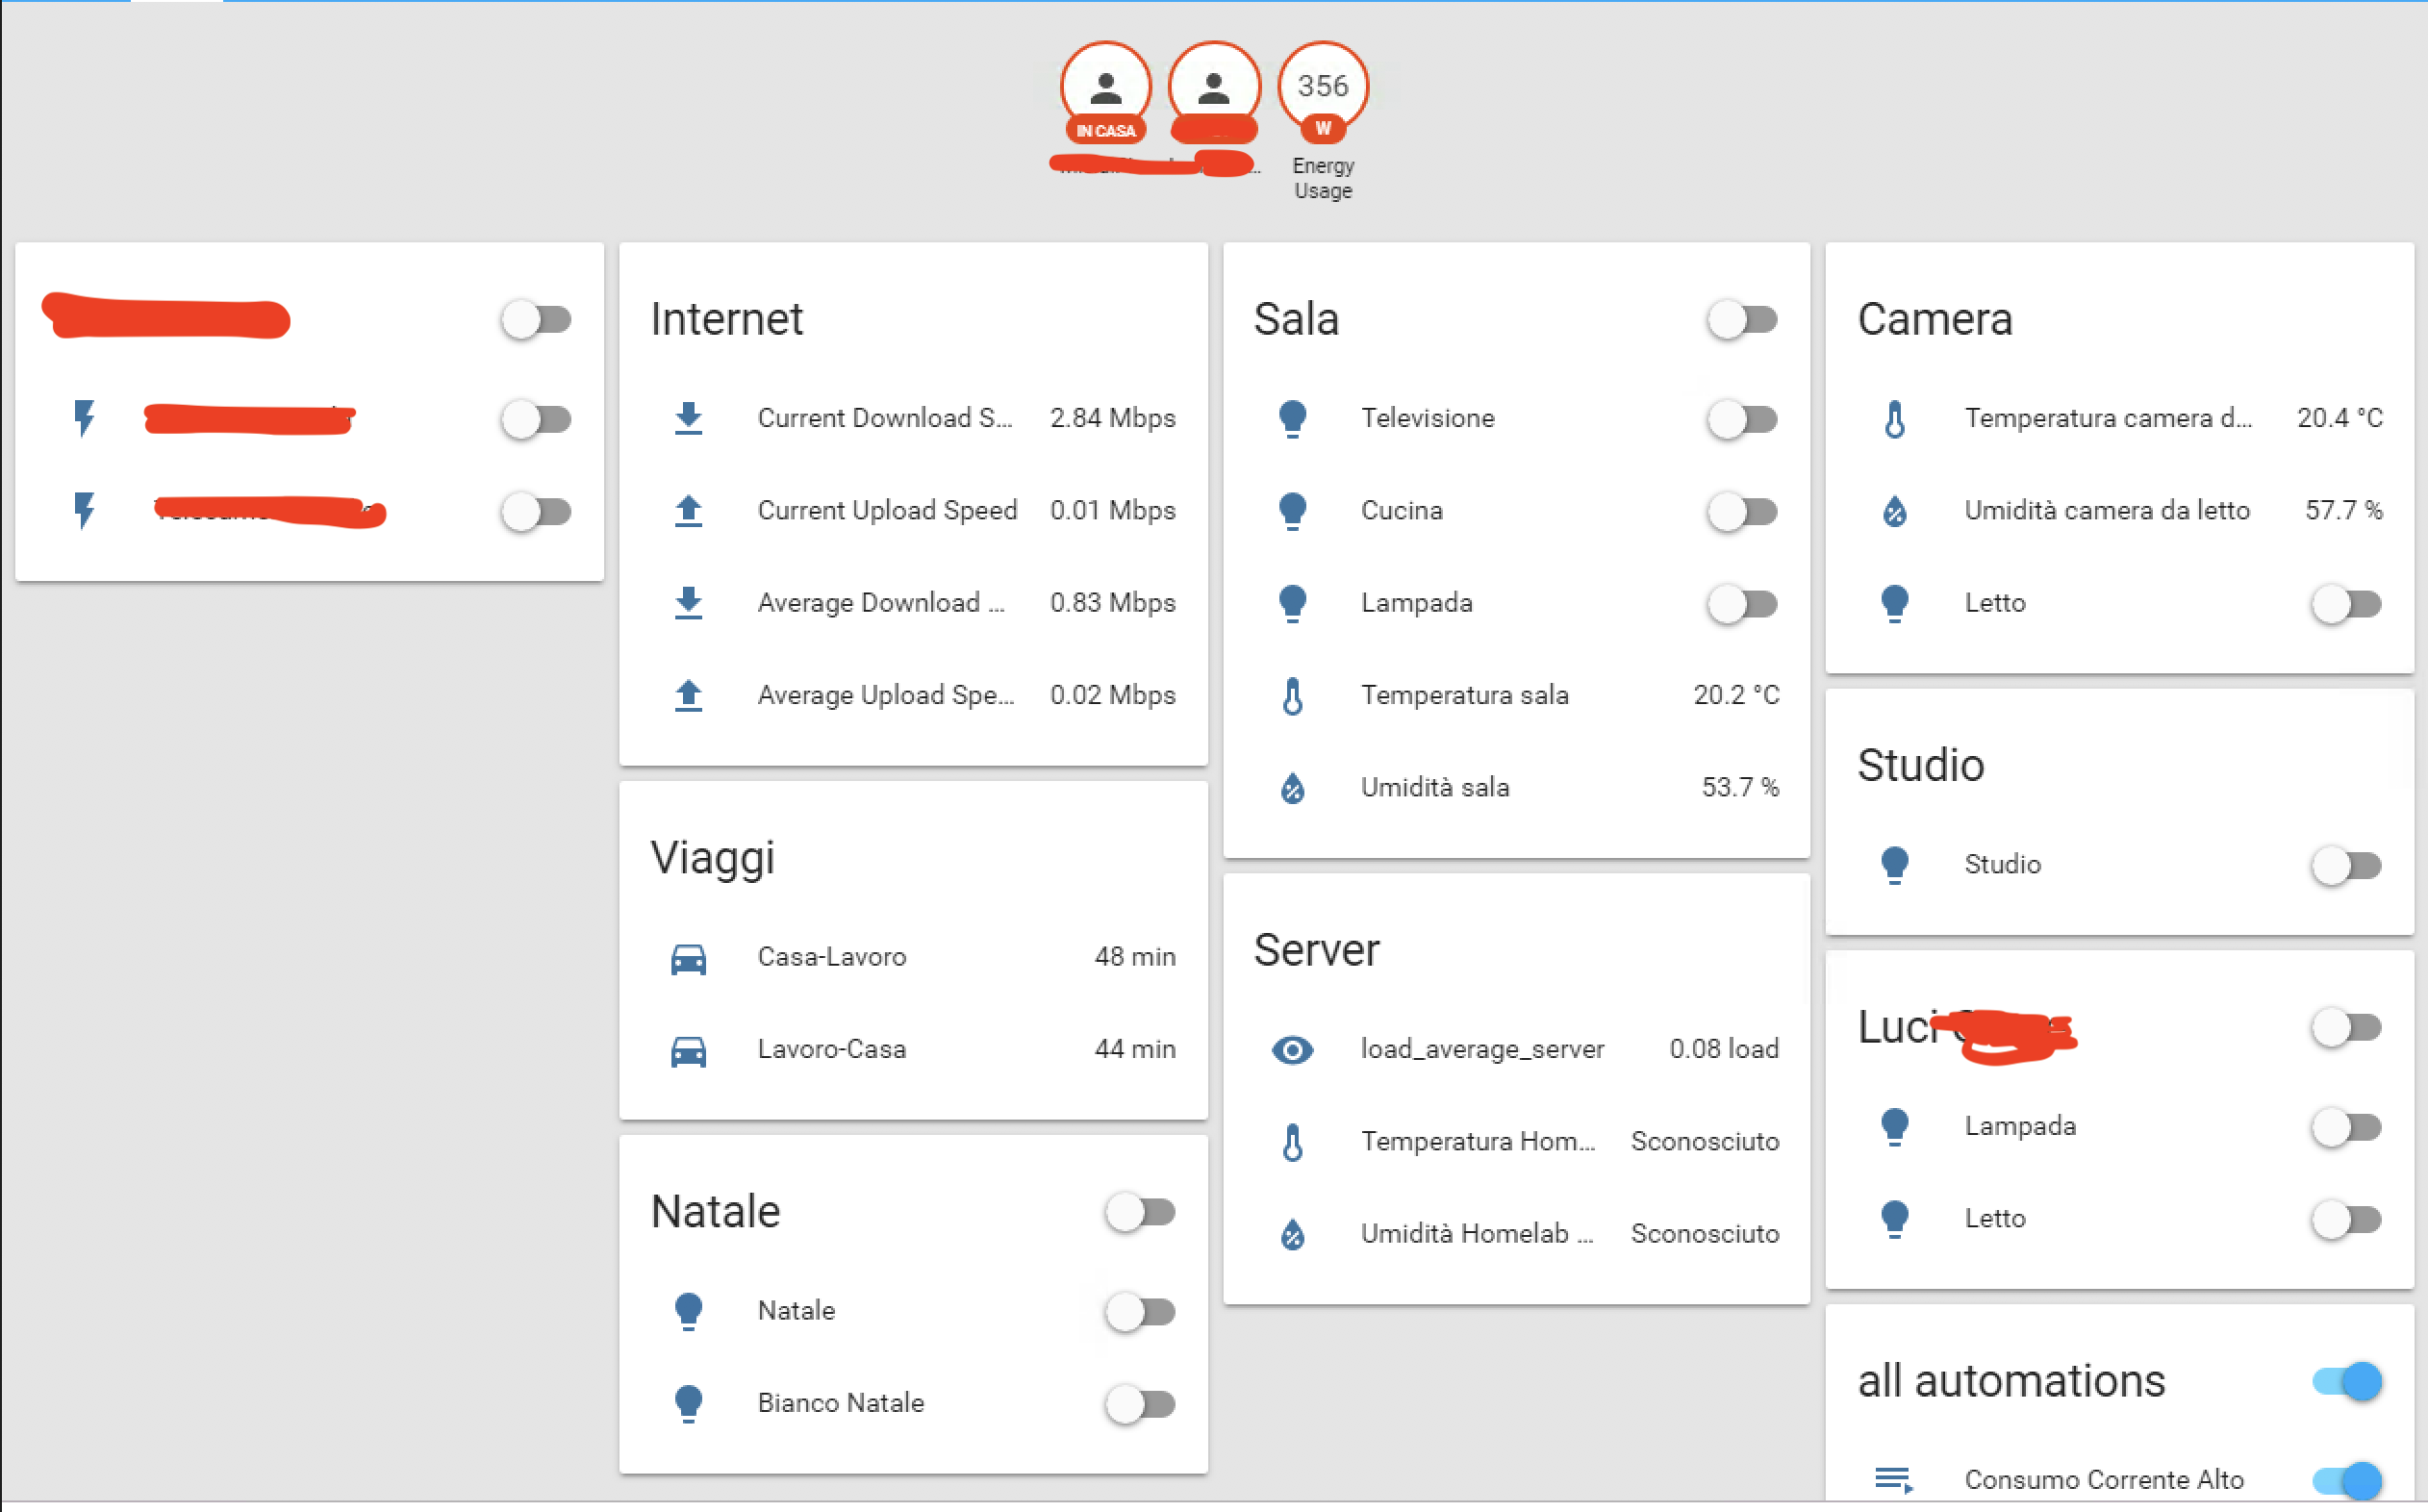
Questa è la schermata principale del mio Home Assistant:
É totalmente personalizzabile nel mood grafico, cosa che però non ho fatto e non penso che farò, perchè sono totalmente incapace in tutto ciò che ha a che fare con grafica e UX 🙂 quindi mi sono concentrato più su quello che c’è sotto il cofano.
Bando alle ciance, un breve indice e poi si parte.
Di cosa parleremo in questa serie di articoli?
Videosorveglianza: collegare e gestire telecamere, accenderle e spegnerle quando necessario
Controllo luci: gestione di luci di vari generi e vendor, automazioni per gestirle in base agli orari o a determinate condizioni
Comandi vocali: utilizziamo Siri per gestire luci, e magari anche la TV
Controllo temperature e alert: fa freddo? fa caldo? E se fa troppo caldo, ti avviso.
Tempi di viaggio previsti: a che ora parto per andare a lavoro?
Teniamo d’occhio i consumi di corrente: Engage Efergy
Videosorveglianza
In alto a sinistra vediamo le Telecamere, i primi componenti che ho iniziato a controllare con Home Assistant, che in questa immagine sono spente. Why?
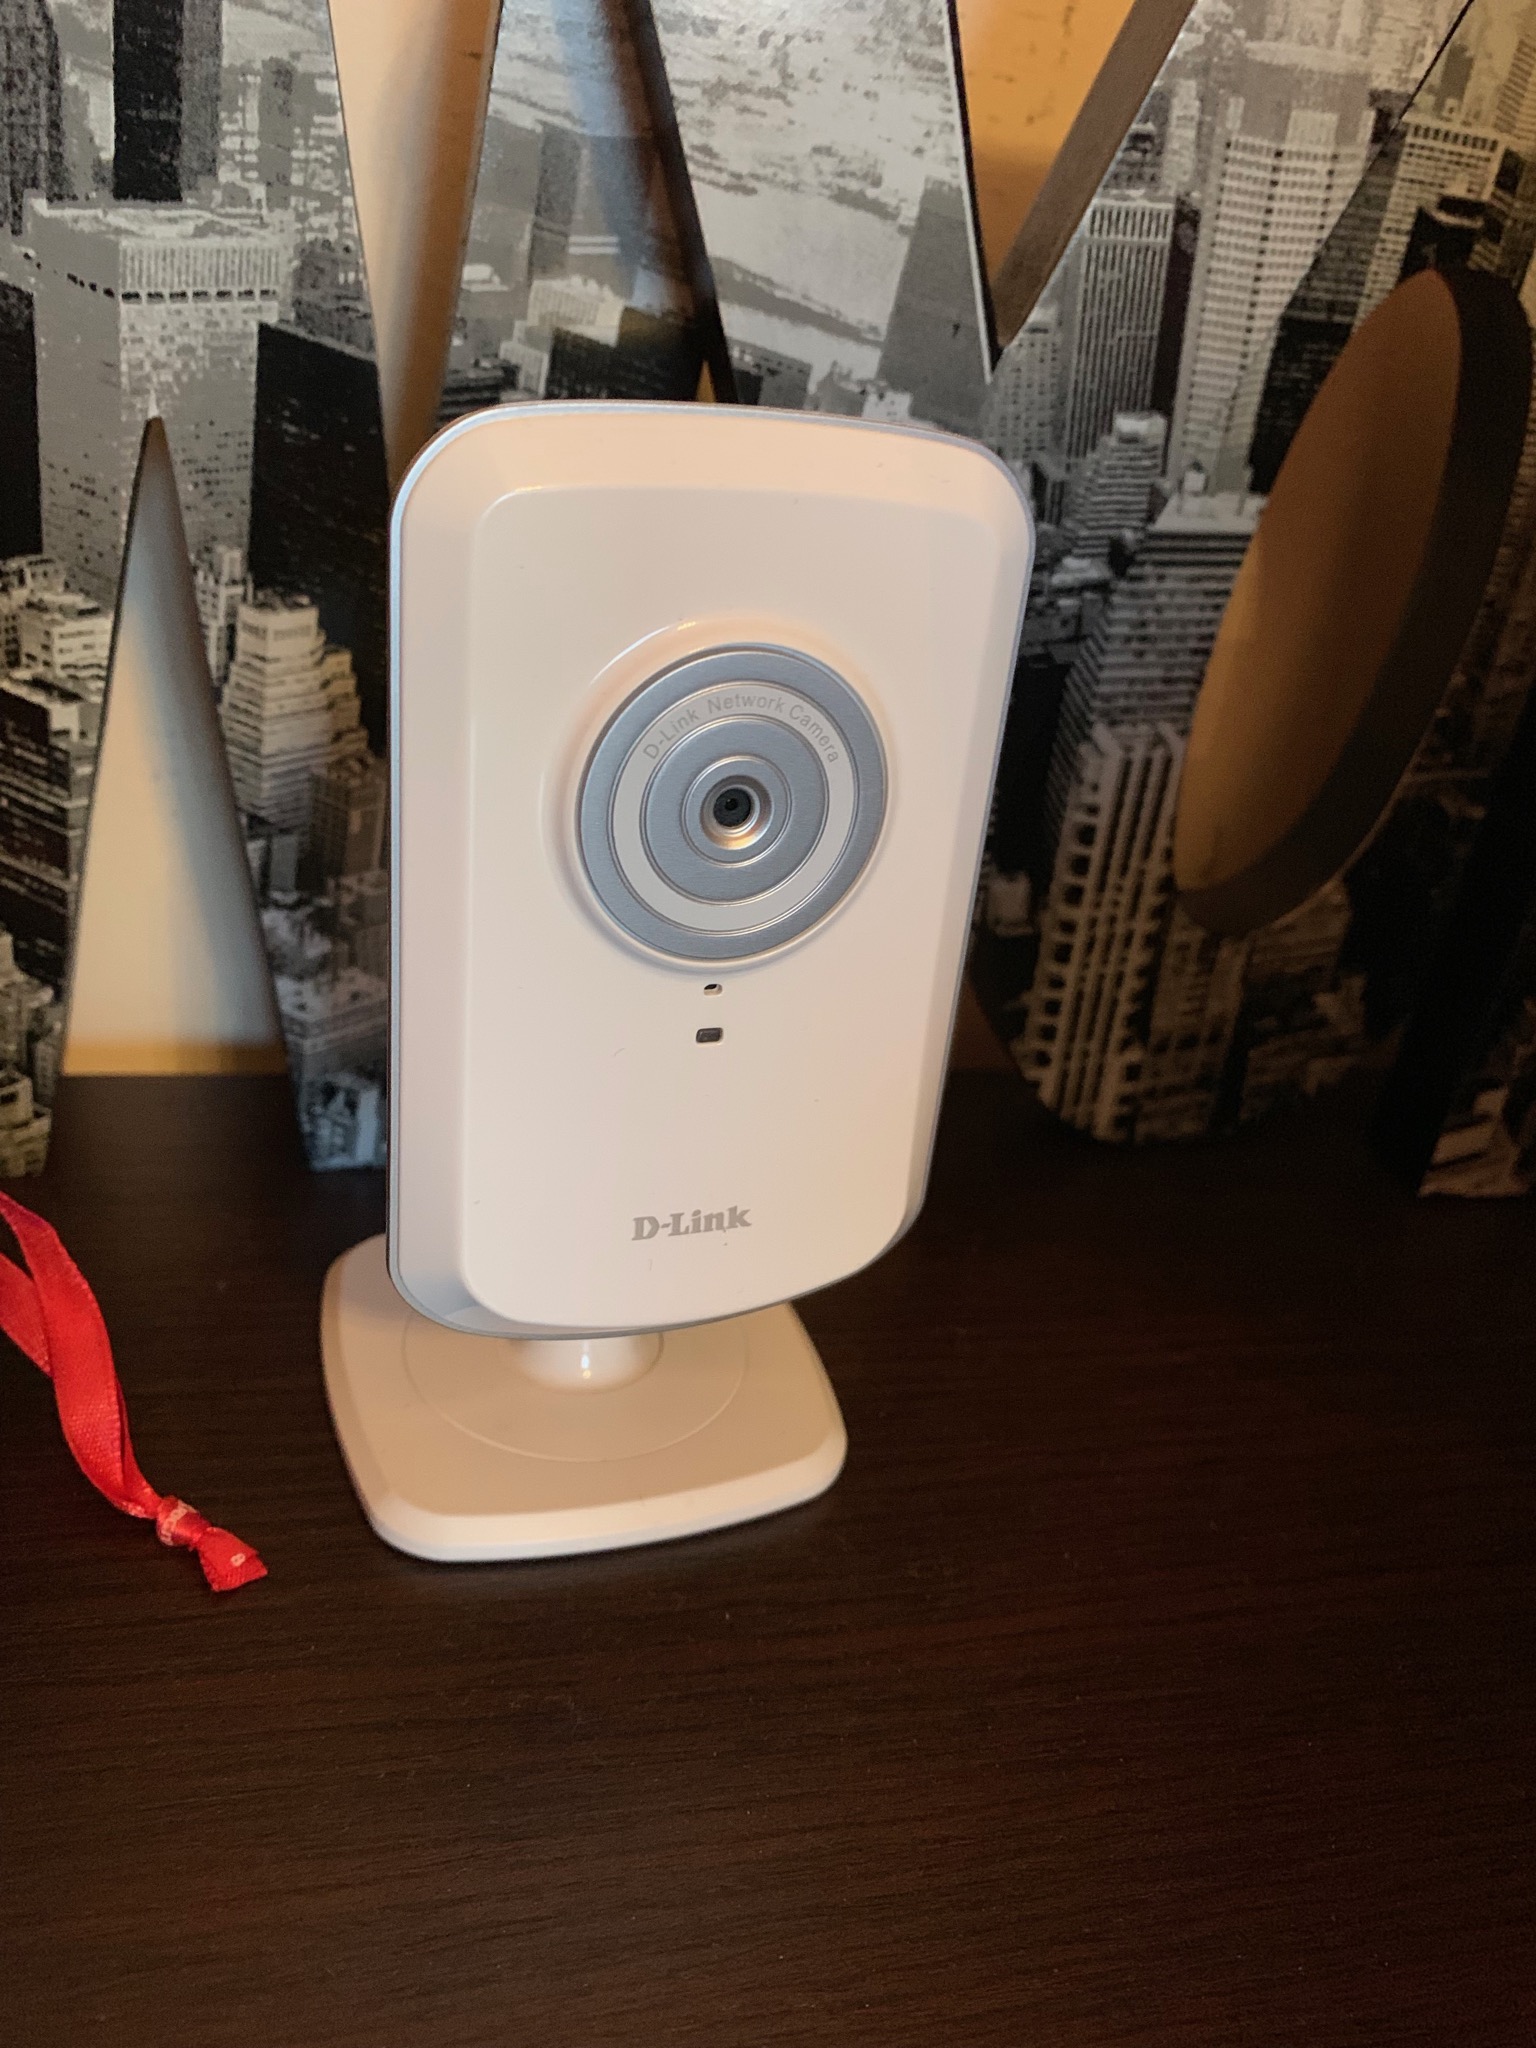
La prima esigenza è nata proprio così: ho 2 telecamere D-Link (vecchiotte), che supportano 2 funzionalità importanti, motion detection e alert via e-mail. Purtroppo però non sono programmabili gli orari di attivazione, senza contare che questi orari non sono sempre prevedibili. Come attivare la videosorveglianza ma evitare di ricevere alert quando io o mia moglie siamo in casa? E come rispettare la nostra privacy?
Ho sfruttato alcune componenti di Home Assistant e un po’ di hardware “di riciclo”, che avevo in casa.
Perchè il bello di Home Assistant è proprio questo:
oggi supporta circa 1.200 componenti, quindi è altamente probabile
che il vecchio device IoT che avete comprato 2 anni fa, e che ora è
chiuso in una scatola perchè non si integra con nulla, possa essere
gestito con Home Assistant
Hardware:
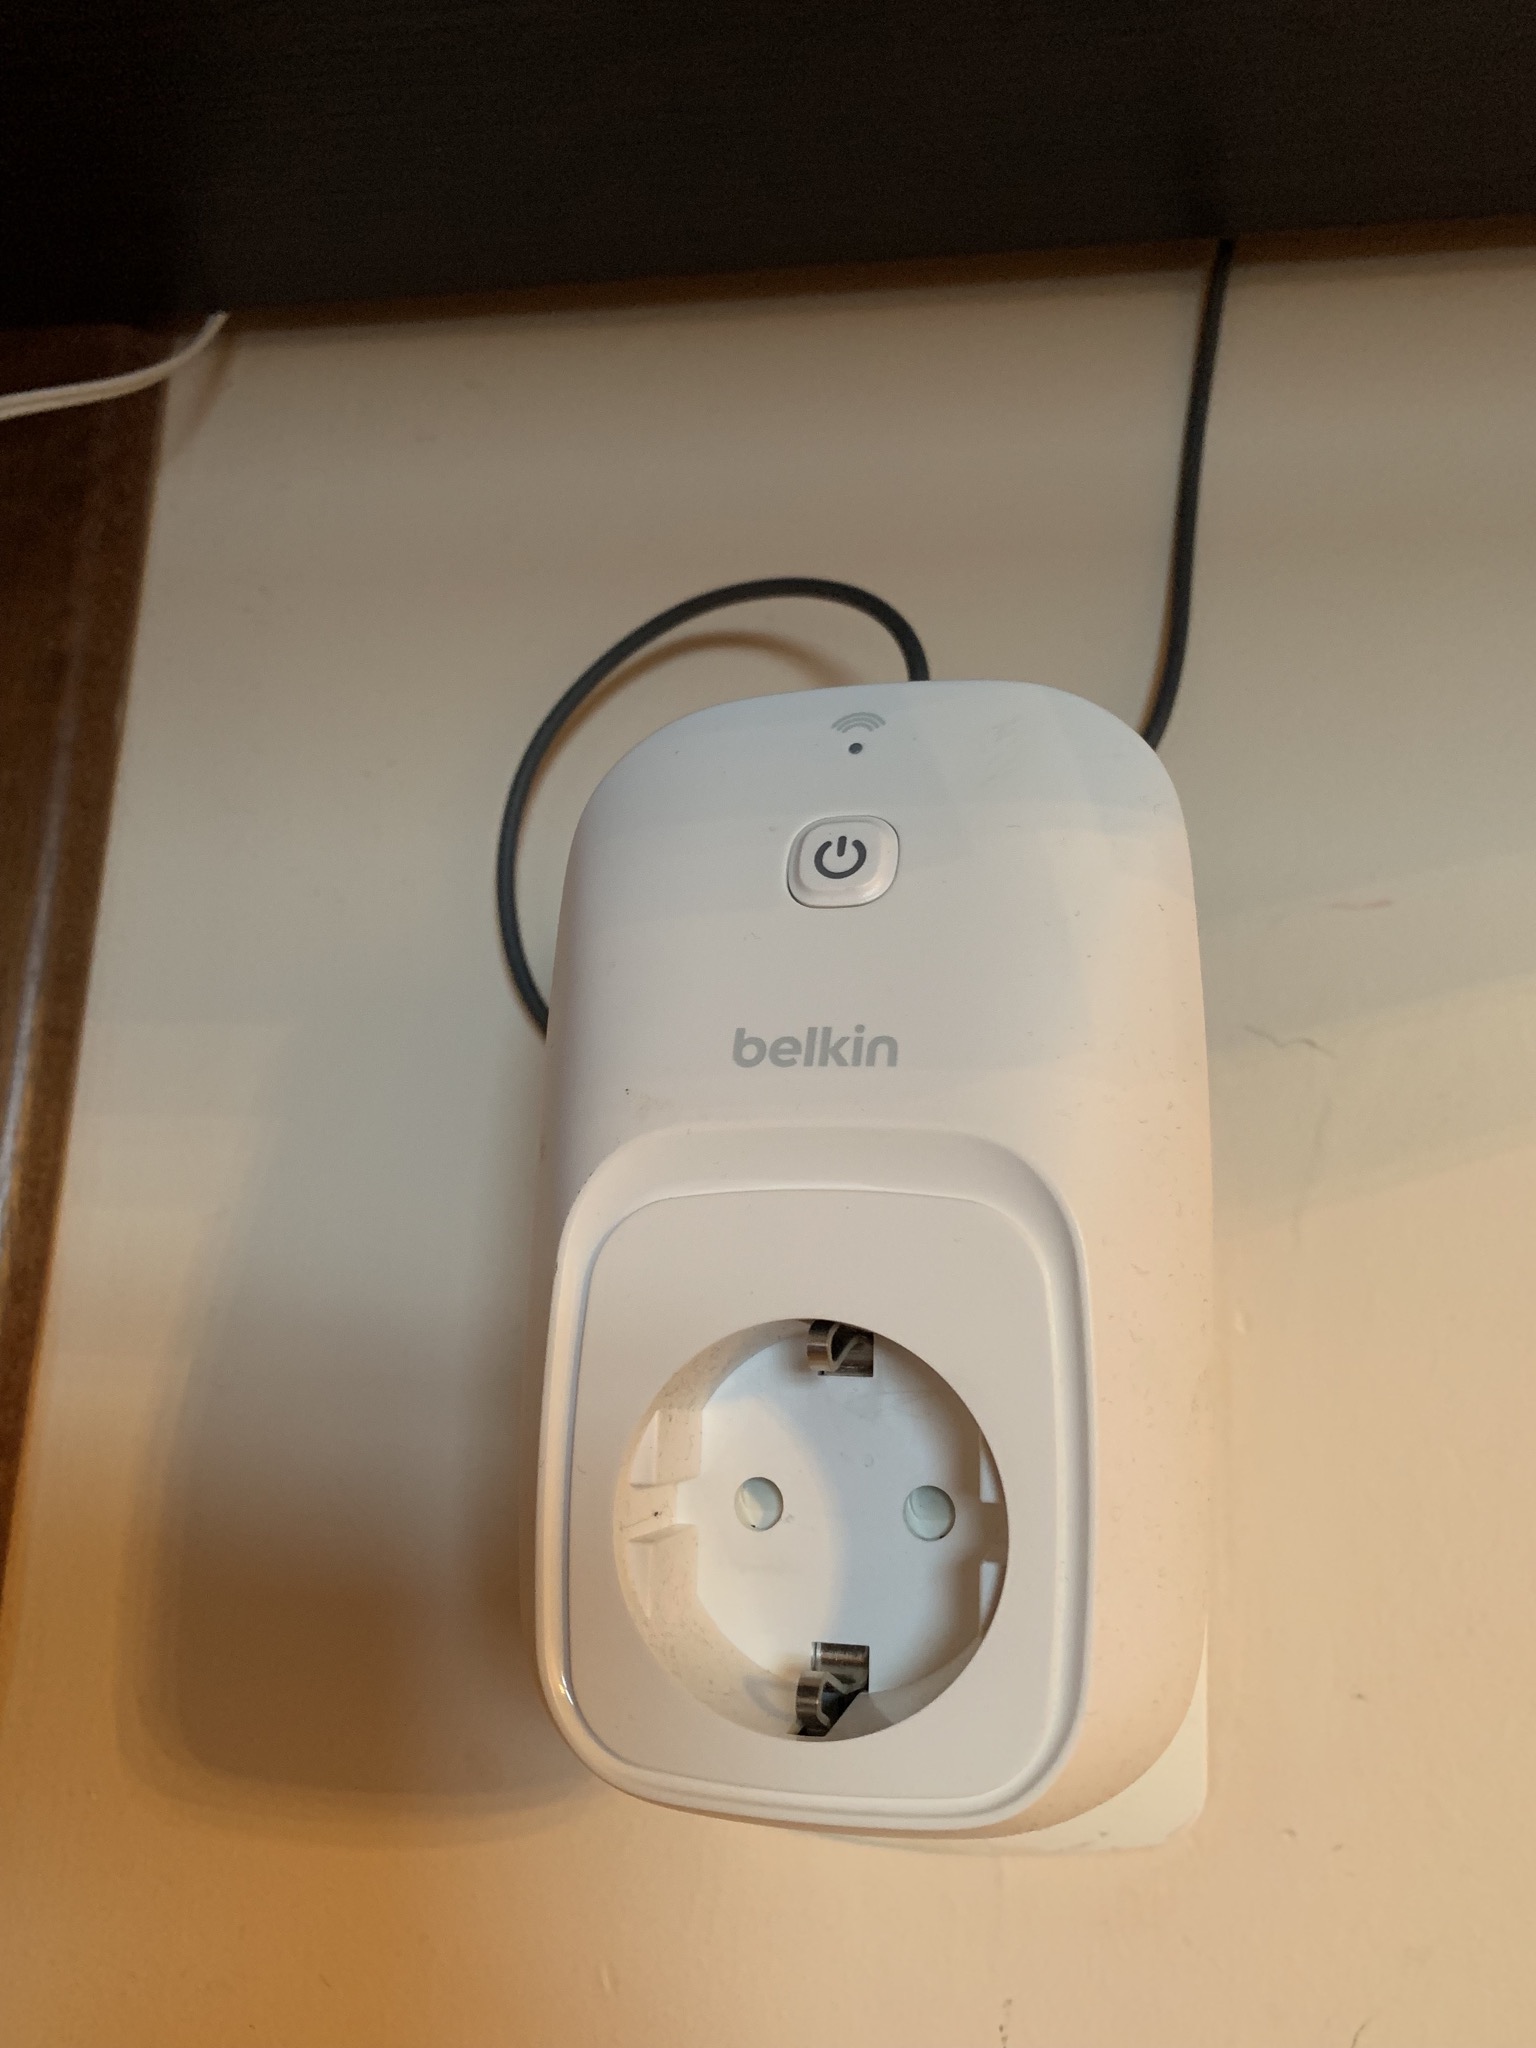
Per l’accensione/spegnimento delle telecamere, ho usato due Belkin Wemo switch
Ovviamente le telecamere 🙂 , due D-Link di cui non ricordo il modello e forse poco importa
Software:
Hass gestisce nativamente gli switch Belkin Wemo, se sono sulla stessa rete locale li autorileva e può controllarli senza bisogno di far nulla. Tutti i device che possiedono un interruttore, sono chiamati “switch” su Hass, e vengono visualizzati con un semplice interruttore on-off nell’interfaccia.
Geolocalizzazione: un altro componente di Hass è il “device_tracker”, componente che rileva la posizione/presenza di un device (tipicamente un cellulare) in vari modi. Può eseguire scansioni temporizzate all’interno della rete con NMap per rilevare se il Mac Address del vostro cellulare è connesso, può basarsi sulla presenza rilevata tramite Bluetooth, oppure (come ho fatto io), sul GPS dei vostri cellulari.
OwnTracks: App disponibile su iOS e Android, traccia costantemente la posizione del vostro cellulare e la invia a un MQTT Broker di vostra scelta. Hass offre questa funzionalità anche con la sua App nativa, ma si tratta di una funzionalità implementata in un secondo momento, che non ho ancora testato.
MQTT: si tratta di un protocollo di messaging “machine to machine” molto leggero, lo useremo per “trasportare” le informazioni di localizzazione da OwnTracks a Hass. Necessità di un server MQTT, nel mio caso ho deciso di utilizzarne uno cloud e gratuito chiamato CloudMQTT. Hass dovrebbe avere un MQTT server integrato, ma anche in questo caso si tratta di una funzionalità aggiunta in seguito, che non ho ancora testato.
NB: Hass ha moltissimi “componenti”, ma un altro componente core che vale la pena citare anche se in questo caso non è stato utilizzato, si chiama “sensor”.
Un Sensor permette di rilevare lo stato di qualsiasi cosa. Esistono sensori fisici (es. un termometro digitale, un rilevatore di movimento, un rilevatore di gas), sensori “virtuali” (es che rilevano le previsioni del tempo, quando il sole sorgerà o tramonterà).
Ora che abbiamo tutti gli ingredienti, la ricetta:
Sorvolo sul collegamento di Switch Belkin Wemo e delle Telecamere, in pochi minuti sarete in grado di collegarli e fare in modo di accendere/spegnere le telecamere dall’interfaccia di Hass.
Una volta fatto ciò, dobbiamo collegare Hass al nostro MQTT Broker, in configuration.yaml andiamo a inserire i dati di CloudMQTT (dopo esservi iscritti, li trovate nella vostra area personale)
In configuration.yaml andiamo a inserire i seguenti dati (NB yaml è sensibile all’indentazione, quindi ricontrollatela bene perchè potrebbe essere “saltato” qualche spazio durante il copia e incolla)
questi stessi dati andranno inseriti su OwnTracks, con l’aggiunta di un id che identifichi il cellulare (chiamato Topic nel gergo di MQTT). Nel mio caso avremo 2 topic, uno per il mio cellulare (es marito) e uno per mia moglie.
A questo punto, nel file known_devices.yaml di Hass andiamo a inserire 2 nuovi devices:
your_username_marito:
  name: MaritoiPhone
  track: yes
  hide_if_away: no

your_username_moglie:
  name: MoglieiPhone
  track: yes
  hide_if_away: no
Mancano ancora un paio di cose. Sempre in configuration.yaml dobbiamo inserire la posizione di casa
zone:
  name: home
  latitude: 11.12345
  longitude: 22.23456
  radius: 250
(NB ho scelto un raggio un po’ ampio, 250 metri, ma nulla vi vieta di modificarlo. Fate un po’ di prove, la scelta giusta dipende anche dalla precisione del vostro cellulare)
A questo punto, Hass dovrebbe essere in grado di rilevare se siete in casa o no:
Infine, dobbiamo creare un “gruppo” per la famiglia (per rilevare quando almeno un membro della famiglia è in casa), e uno con gli switch delle Telecamere (per accenderle/spegnerle entrambe contemporaneamente)
A questo punto siamo pronti per creare la nostra automation
automation:
  - alias: Turn on camera when family outside
    trigger:
      platform: state
      entity_id: group.family
      from: 'home'
    action:
      - service: switch.turn_on
        entity_id: group.telecamere
      - service: notify.ios_iphone_di_lombax
        data:
          message: "Telecamere accese"
          data:
            push:
              badge: 0
              category: "DEFAULT_NOTIFICATION"
  - alias: Turn off camera when family inside
    trigger:
      platform: state
      entity_id: group.family
      to: 'home'
    action:
      - service: switch.turn_off
        entity_id: group.telecamere
      - service: notify.ios_iphone_di_lombax
        data:
          message: "Telecamere spente"
          data:
            push:
              badge: 0
              category: "DEFAULT_NOTIFICATION"
Molto semplice, come potete vedere.
Nella prima automation stiamo dicendo che quando lo “state” del gruppo “family” non è più “home” (ricordate come abbiamo chiamato la zona di casa nostra?), deve scattare una action “switch.turn_on” sul gruppo “telecamere”. Nel secondo, viceversa.
In questa configurazione vedete anche un “service” specifico per le notifiche. Si tratta di un tema che vedremo in uno dei prossimi articoli, vi basti sapere che…quando l’automazione si verifica, ricevo una notifica push sul mio cellulare.
Da appassionato di tutto ciò che è il mondo informatico, ho sempre avuto voglia di “toccare con mano” le tecnologie che ritengo più interessanti. Un po’ come il garage è “la stanza dei giochi” per un appassionato di meccanica o bricolage, l’HomeLab è la stanza dei giochi dell’appassionato di informatica, qualcosa che nasce per hobby, e viene coltivato sempre per hobby. Poi, nel tempo, diventa utile…probabilmente (almeno nel mio caso) non indispensabile…perchè poter dire “ehi Siri, accendi il Natale” per far accendere l’albero e varie luci colorate è cool, ma si può vivere anche senza 🙂
Questa sarà l’intro di una serie di articoli più tecnici e hands on, penso che una premessa – prima di entrare nei dettagli dei singoli servizi e tecnologie utilizzate per realizzare il mio HomeLab – sia d’obbligo. Farà anche un po’ da indice per i prossimi articoli.
Quindi…com’è il mio HomeLab? Cosa fa? A che serve? Come è organizzato?
Io direi di partire dai servizi, principalmente domotica, automazione, monitoring e multimedia in casa:
– fa da hub per tutti i dispositivi domotici che ho in casa (lampadine Philips Hue, switch Belkin Wemo e Sonoff, termometri “artigianali” sviluppati su Raspberry Pi, TV), permettendomi di accenderli e spegnerli da remoto (pc o cellulare), di controllare le temperature ecc…
– si interfaccia con Siri e HomeKit di Apple, permettendo a me e mia moglie di controllare gli stessi dispositivi con comandi vocali ai nostri iPhone o Apple Watch. “Ehi Siri, accendi le luci della Sala”, “spegni le luci della Camera”, “imposta luci calde in Studio”, “dimmi che temperatura c’è in Soggiorno”.
– gestisce la TV (Samsung Smart TV), permettendoci di accenderla, spegnerla, gestire canali e volumi sempre tramite controllo vocale
– ci permette di memorizzare file (documenti, foto, video) in una condivisione di grandi dimensioni e al tempo stesso proteggerli (encryption + backup offsite – in particolare su Amazon AWS S3), ci permette di vederli direttamente in tv condividendoli con il protocollo DLNA.
– gestisce il nostro “mini” impianto di videosorveglianza, la casa è piccola ma abbiamo un paio di telecamere, tuttavia per rispetto della nostra privacy preferiamo che si spegnano quando io o mia moglie siamo a casa. Quindi, tramite geolocalizzazione sul cellulare e protocollo MQTT, non appena uno dei due entra in casa, le telecamere si disattivano.
– ci avvisa, tramite notifiche sul cellulare, se qualcosa non va: temperature troppo alte, rilevato movimento dalle telecamere
– gestisce un minimo di automazione: se siamo fuori casa facciamo accendere le luci al crepuscolo, così da non lasciare il cane al buio
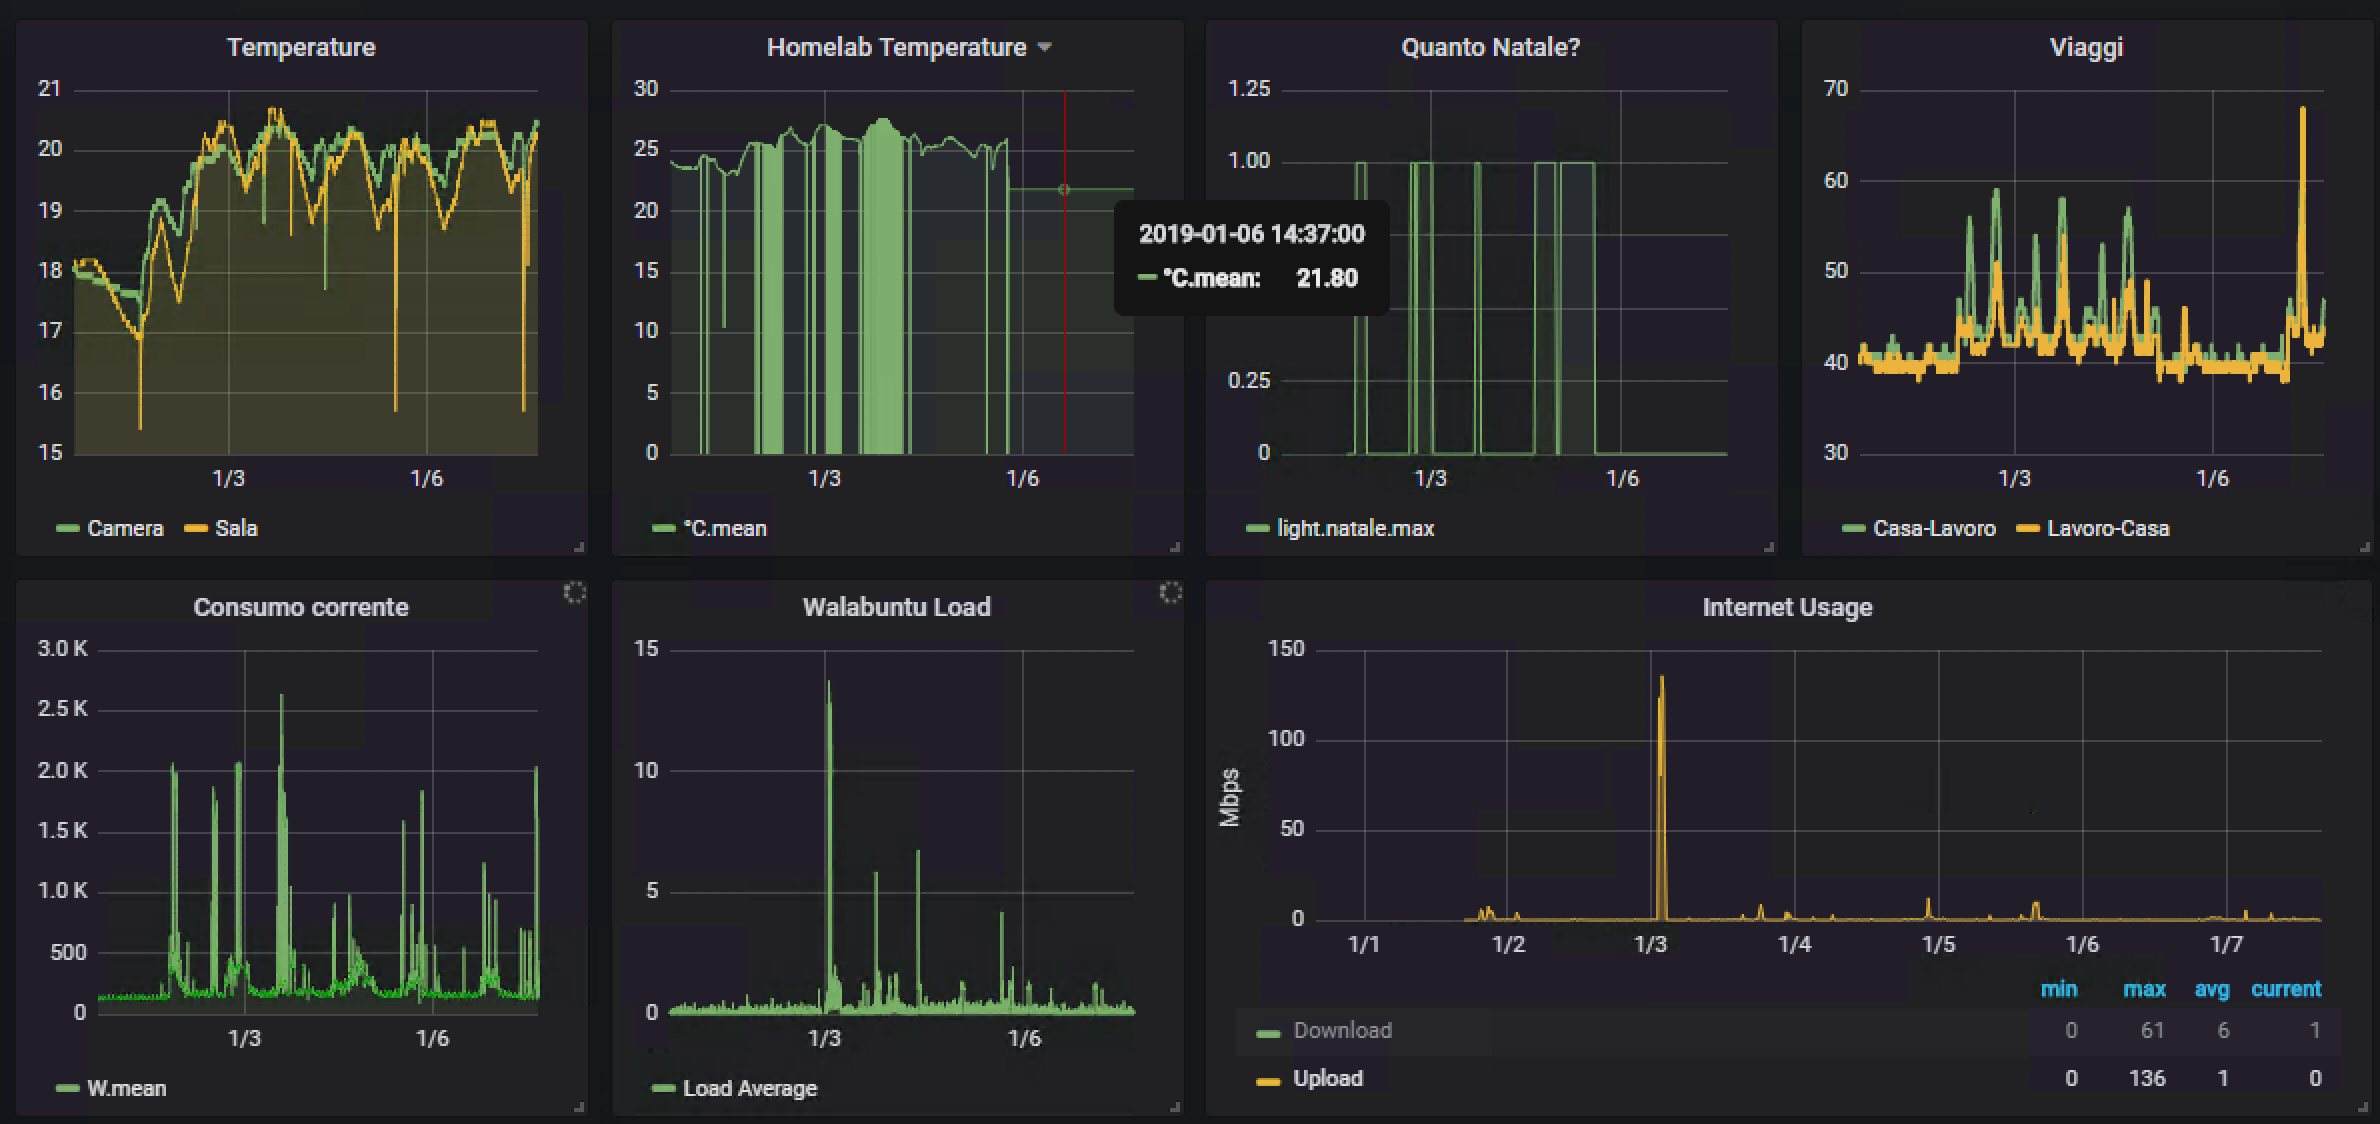
– permette di monitorare consumi elettrici, banda internet, temperature delle varie stanze, con grafici facilmente esplorabili
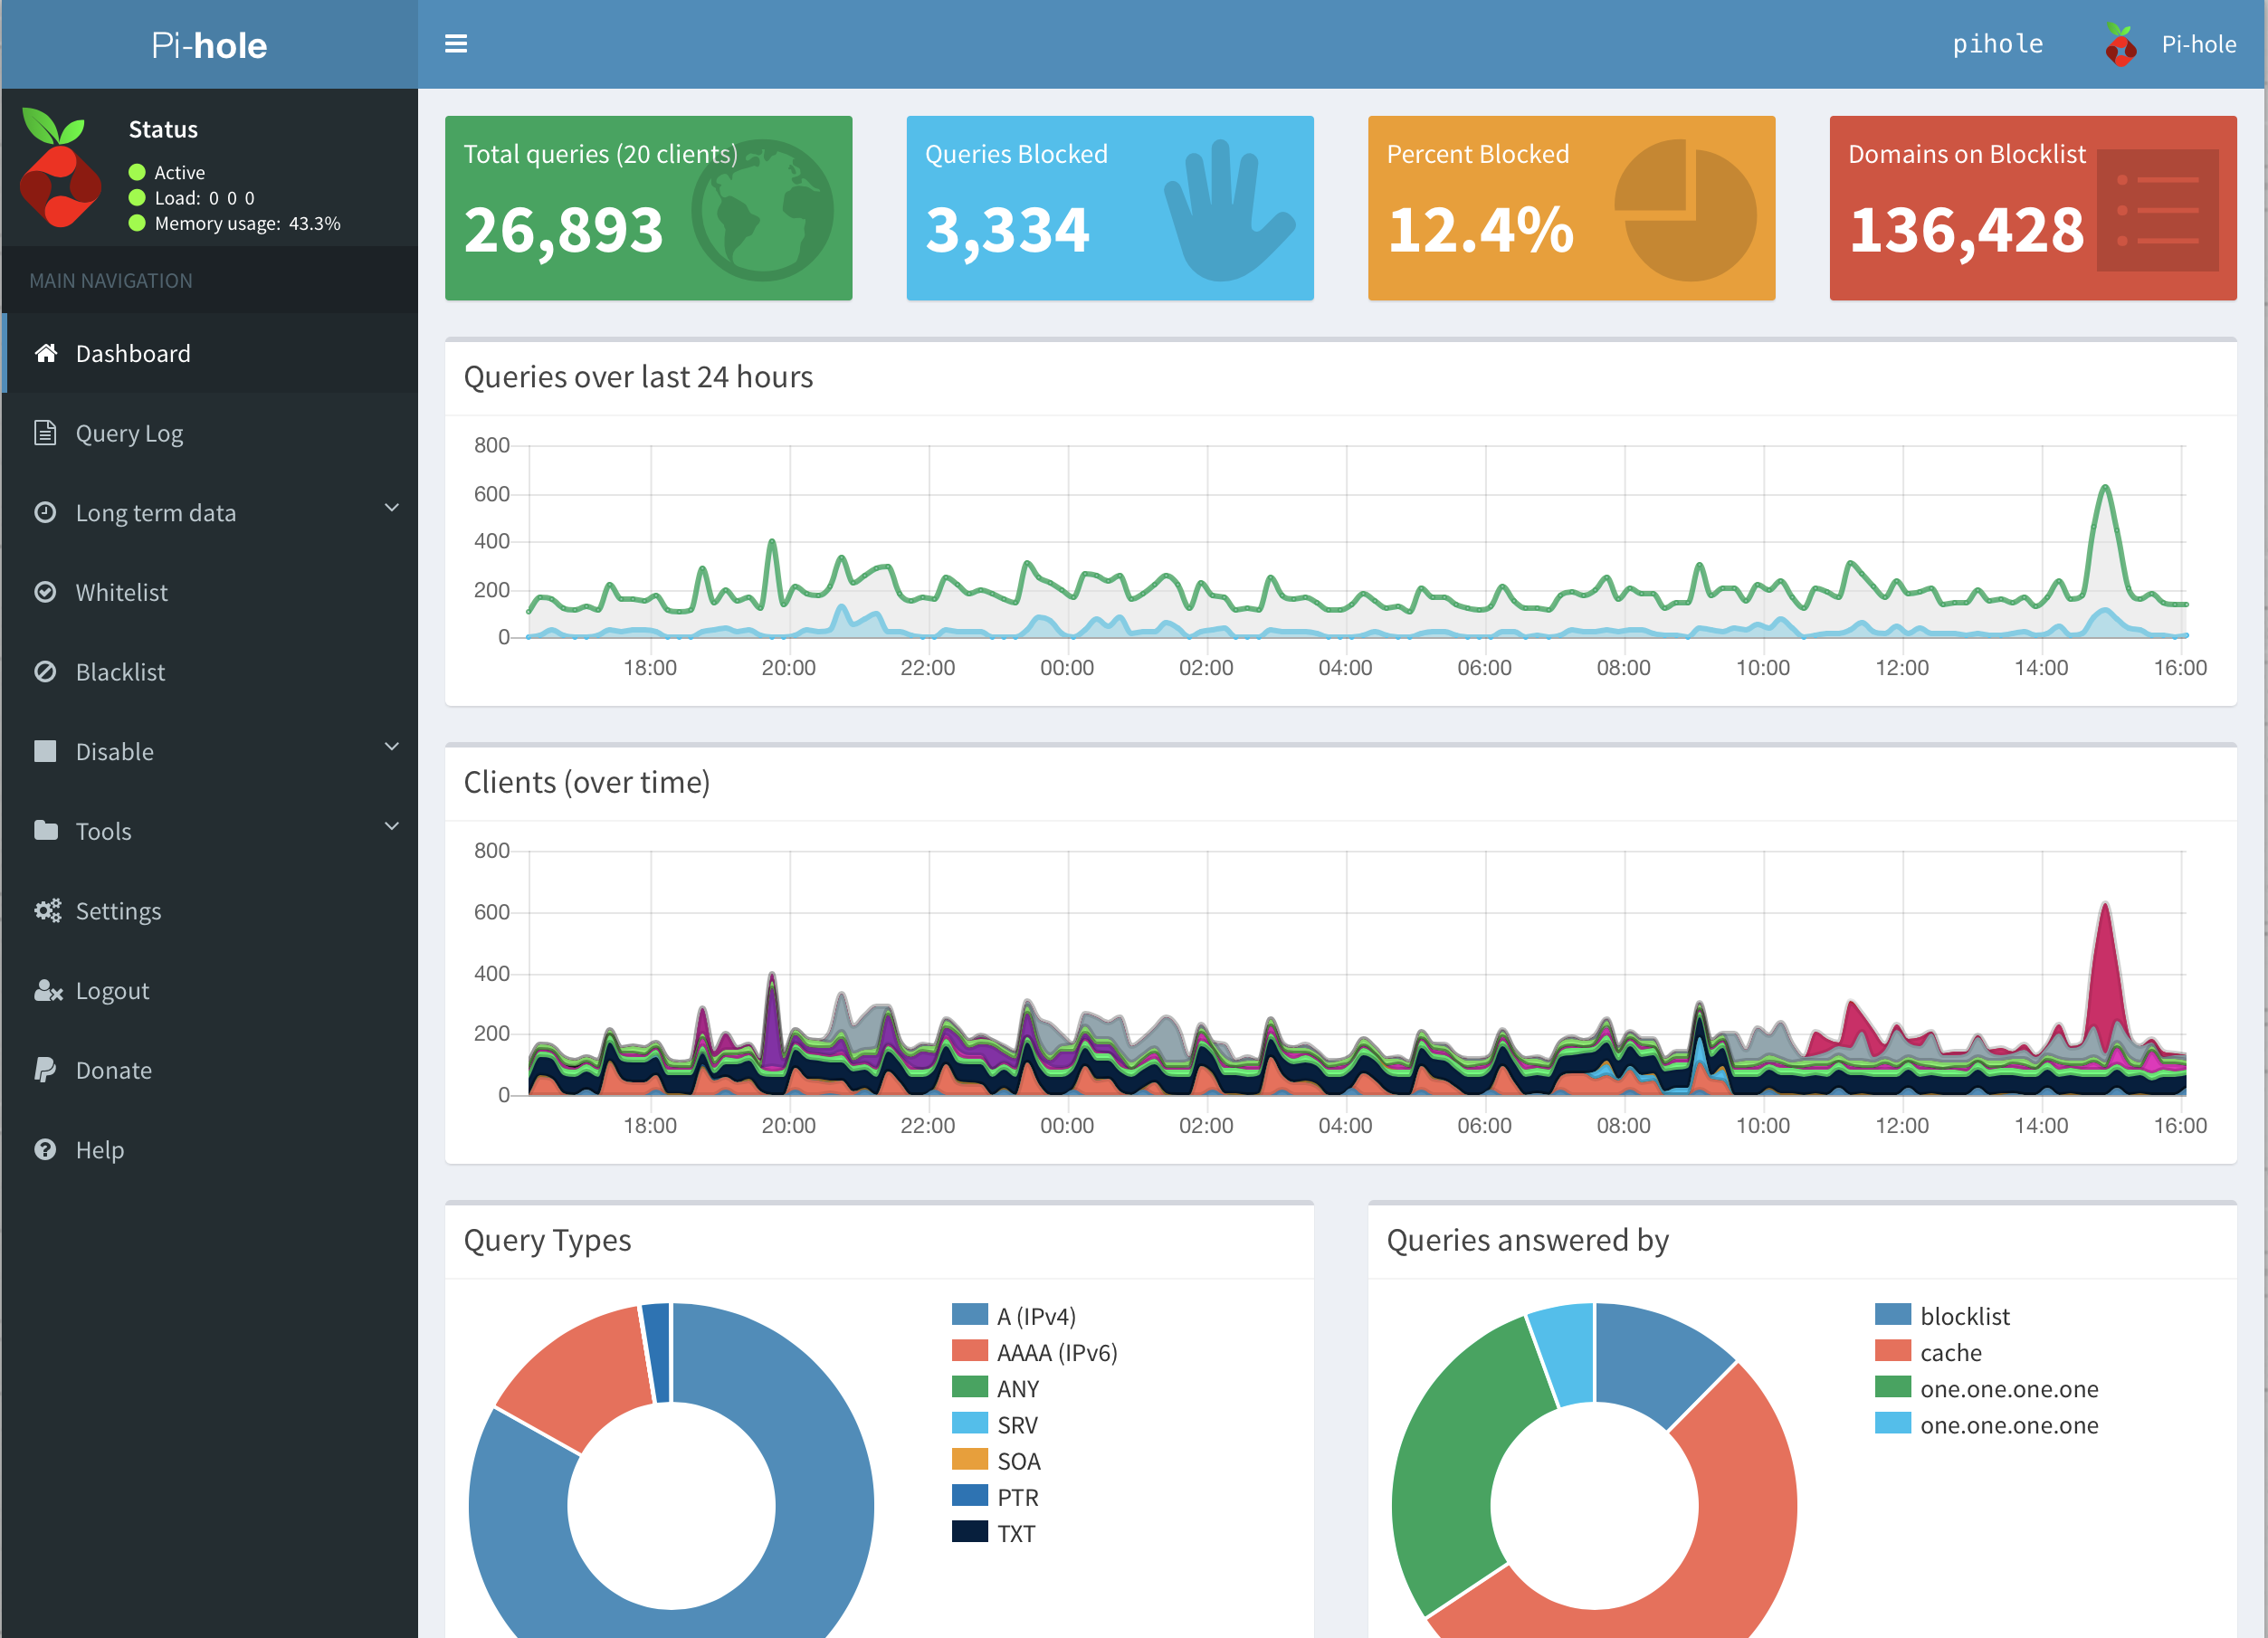
– protegge, filtra e monitora la navigazione internet (tramite Pi-hole e protocollo SNMP)
…e questa lista è in continua evoluzione 🙂
Il componenti principali, ad oggi, sono:
Software
– Home Assistant: è l’hub di automazione principale, in brevissimo, si connette a tutti i device IOT della casa e permette di interagirci da un’unica interfaccia, integrata con HomeKit (e anche con la concorrenza… 🙂 ). Scriverò un articolo specifico in proposito, ma nel frattempo potete informarvi meglio quì: Home Assistant
– Grafana: software per creare dashboard come queste
– InfluxDB, memorizza tutte le metriche da HomeAssistant e altri servizi, permettendo poi di visualizzarle su Grafana
– Pi-hole, dns server che blocca la maggior parte dei domini di advertising, phishing e malevoli, rendendo più sicura e anonima la navigazione internet
– MiniDLNA per condividere in rete i file multimediali e vederli dalla tv
– Un po’ di software custom (linguaggi principali utilizzati: PHP, Javascript con Node.js, Python e un bel po’ di sano bash scripting) scritto per fare da “collante” dove necessario.
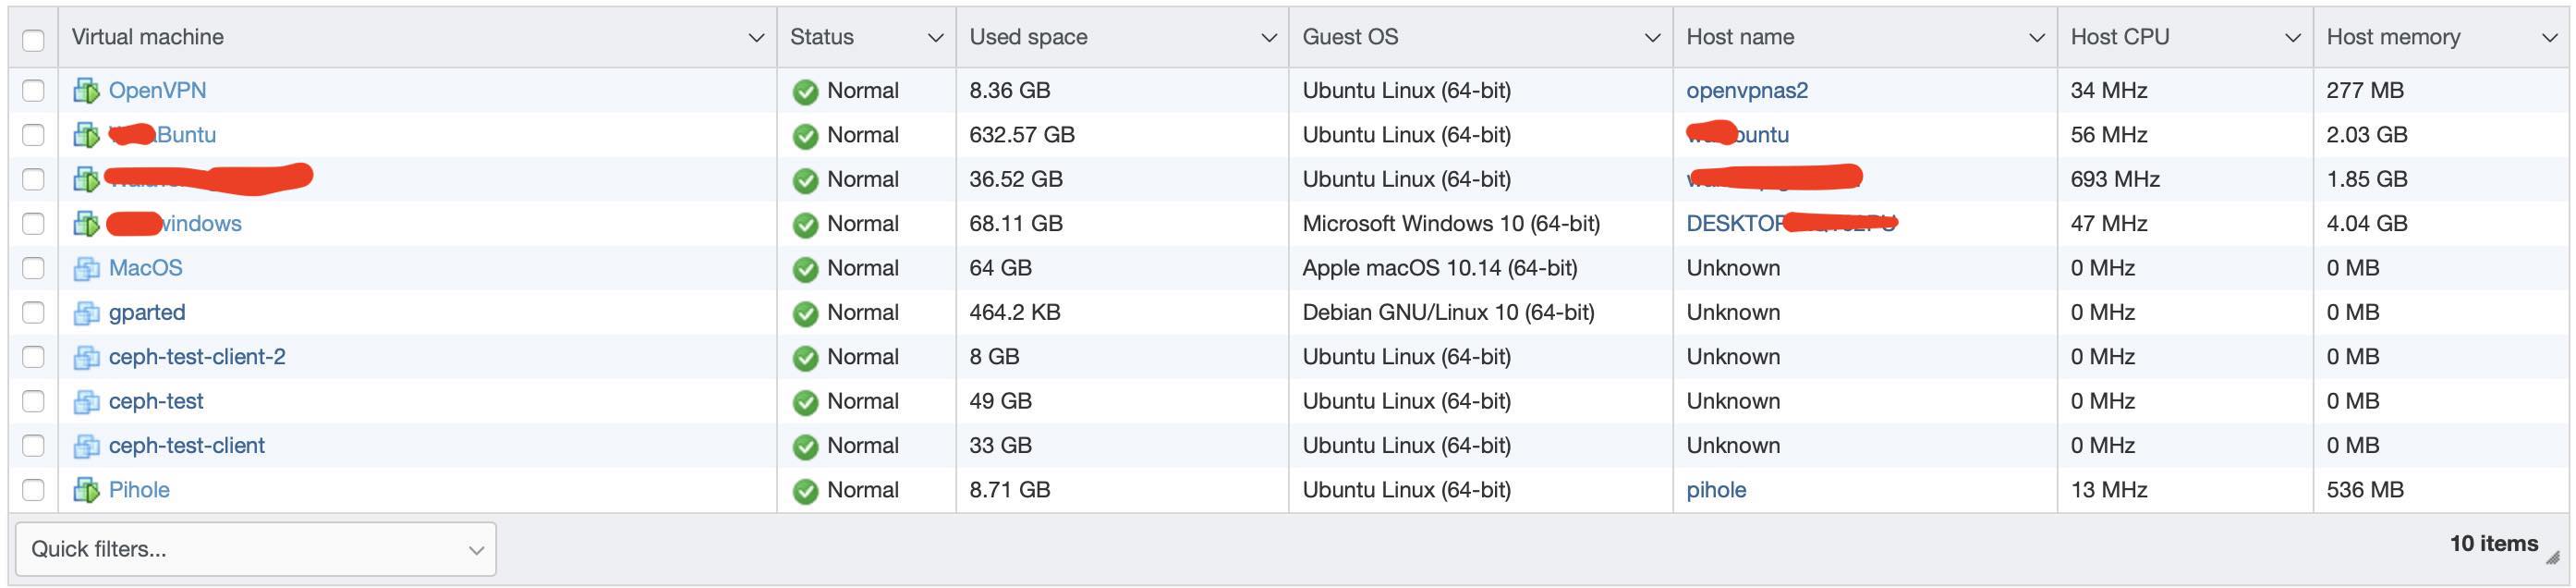
– OS: il mio OS principale è MacOS, ma adoro anche Linux e in casa mia non viene discriminato nemmeno Windows, in questo momento (tra portatili, fissi e virtuali) almeno una 15ina di macchine: 2 mac, 3 windows, il resto Linux (Ubuntu o Raspbian, in generale sono della squadra Debian) 🙂
– Apple Homekit per i comandi vocali
– OWNTracks su cellulare per la geolocalizzazione
– Altri servizi esterni: quando necessario, mi appoggio ad Amazon AWS (in questo momento S3 per i backup) e OVH (macchina virtuale su cui risiede questo sito e alcuni script di controllo). CloudMQTT come broker MQTT per geolocalizzazione e temperature
Hardware
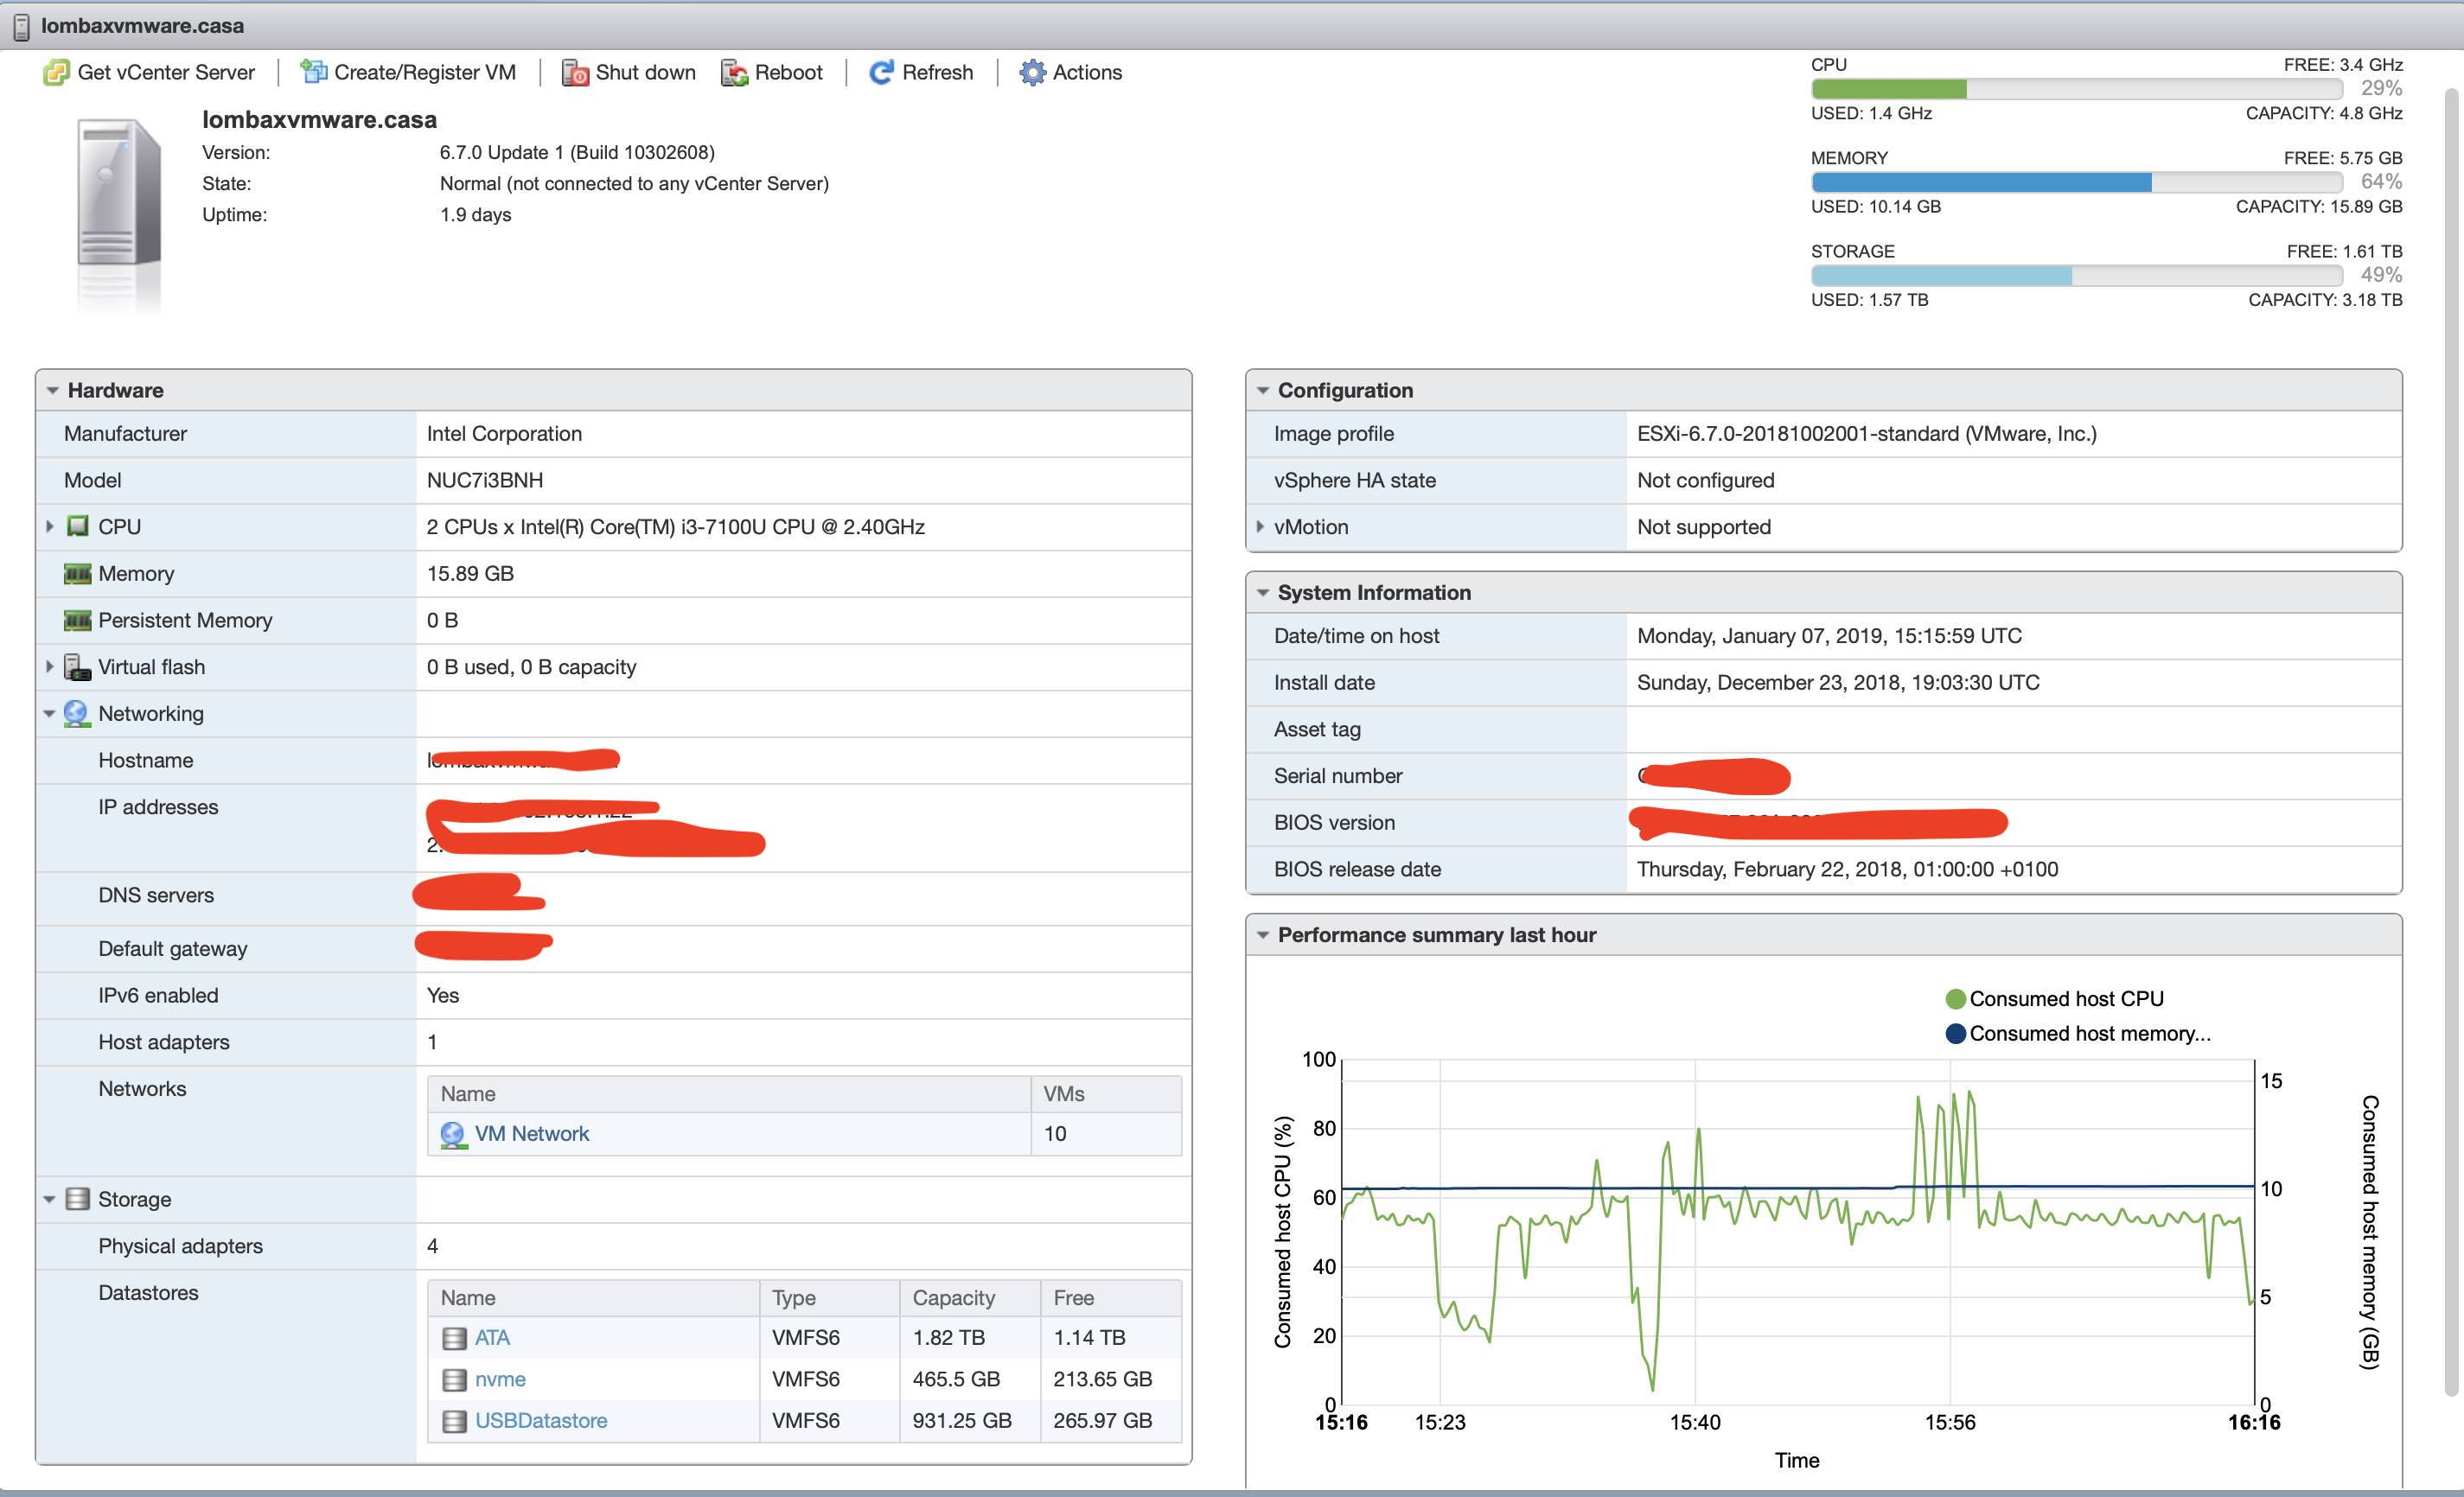
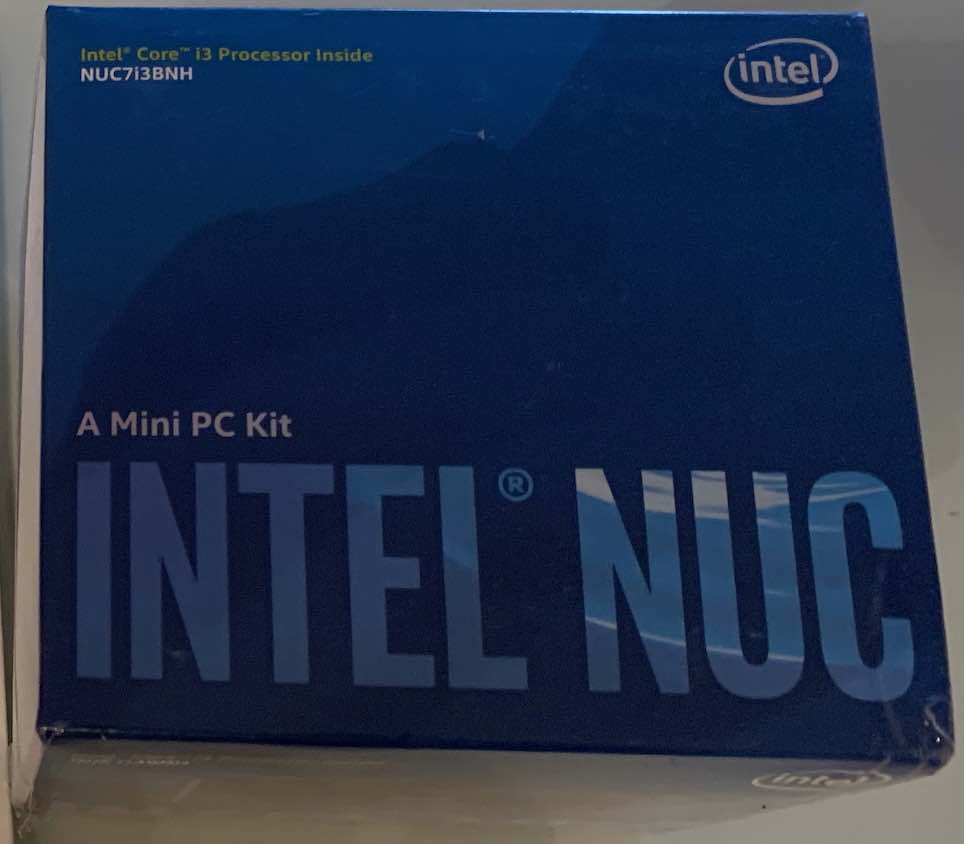
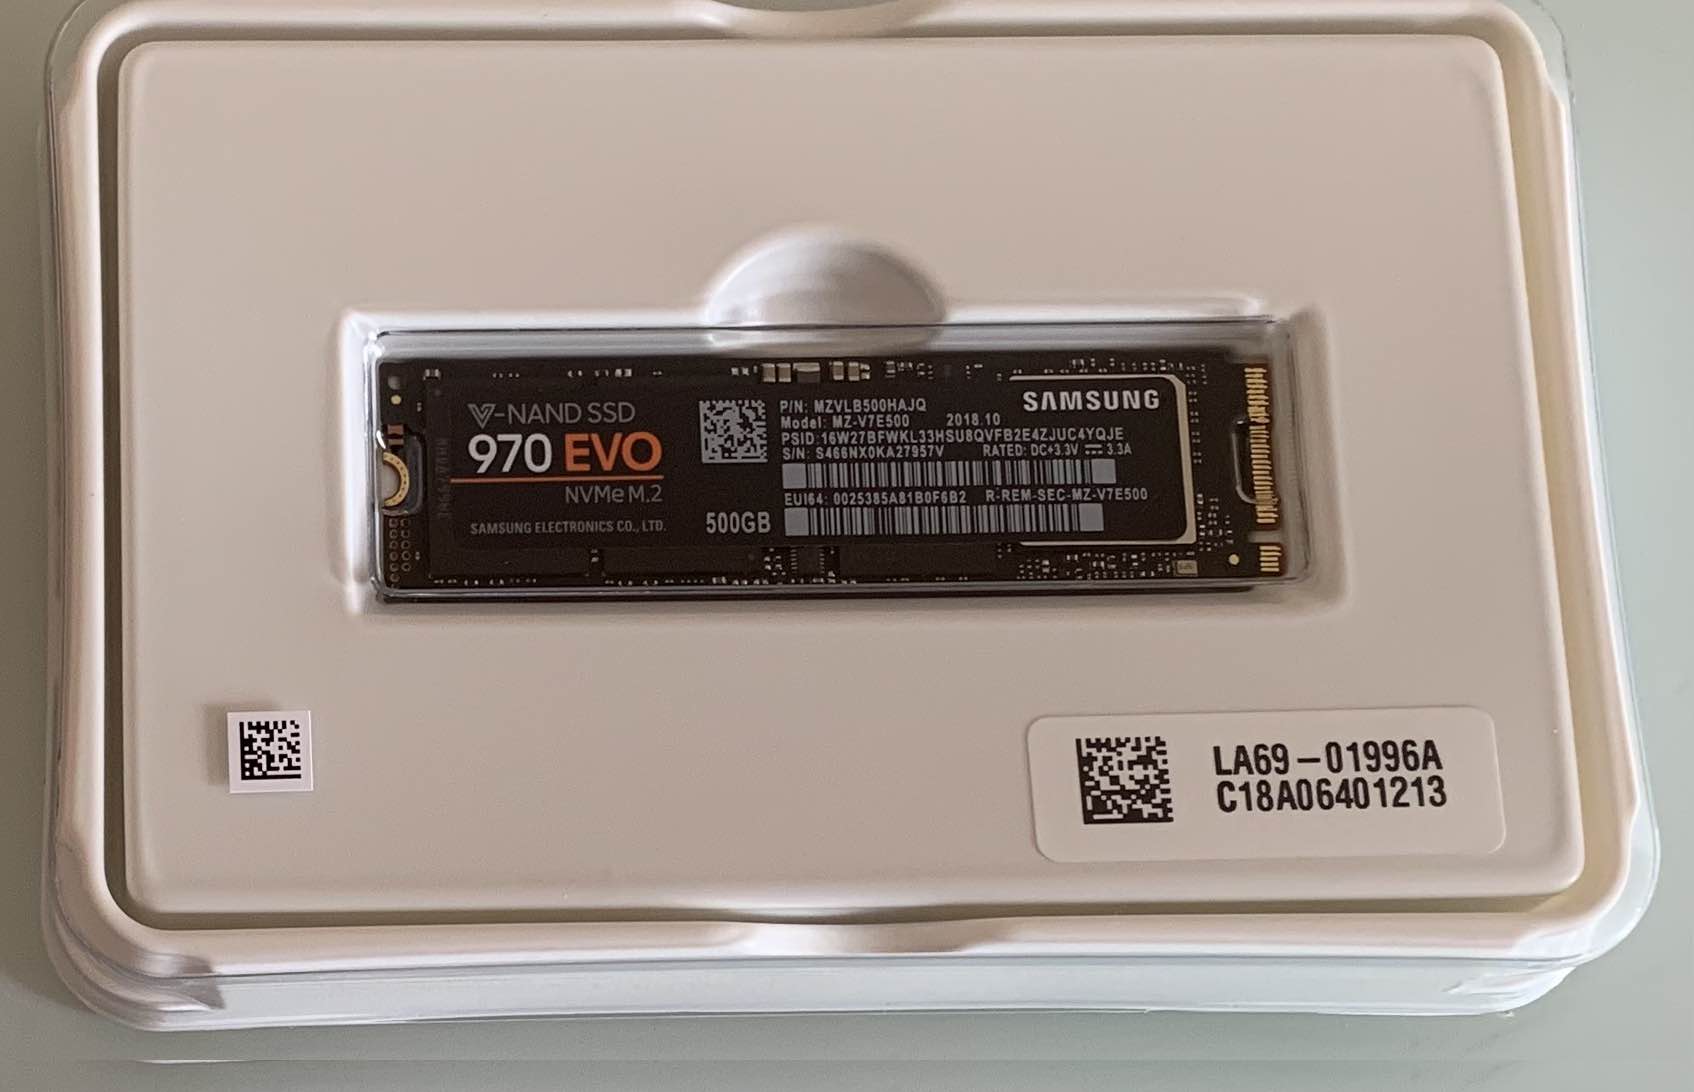
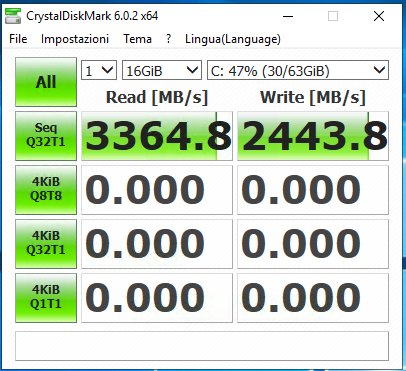
– Intel NUC 7th gen. i3, NVMe Samsun Evo 970 da 500GB per le virtual, Seagate BarraCuda da 2TB per storage, 16GB di RAM
– Alcuni dischi USB esterni per i backup delle macchine virtuali
– Hub e luci Philips HUE
– Hub Engage Efergy per il controllo dei consumi elettrici
– Vari Belkin Wemo e Sonoff come smart switch
– Telecamere D-Link
– UPS
– 4 Raspberry Pi sparsi per casa per controllare temperature (sensori DHT-22) o fare da Thin Client verso le macchine virtuali
I motivi di queste scelte saranno dettagliati negli articoli di approfondimento, ma è bene tener presente alcuni “constraints” che mi hanno portato a farle:
– come detto a inizio articolo, tutto nasce principalmente per hobby. Voglia di provare delle tecnologie, hype, voglia di imparare un particolare linguaggio o usare uno strumento…quindi non cercate troppa logica in quello che ho fatto. Sicuramente si poteva “ingegnerizzare” meglio, ma lo scopo principale era uno solo: intrattenermi, e vi assicuro che ad oggi lo scopo è raggiunto 😉
– spendere “il giusto”. Ognuno di noi ha un concetto, totalmente personale, di quanto sia “il giusto”, e non è sempre uguale in ogni momento della vita. Il mio HomeLab è nato un pezzo alla volta, in alcuni momenti si è evoluto più velocemente, in altri meno. Lo espando per “iterazioni”. Generalmente, se in 2-3 occasioni all’anno sono più libero e mi avanzano 200-300€, mi “coccolo” regalandomi qualche pezzo di hardware nuovo (telecamere, switch, dischi ecc ecc). Tranne questo Natale che ho fatto evaporare una parte consistente di 13esima…ma questa è un’altra storia che leggerete nell’approfondimento dedicato all’Intel NUC.
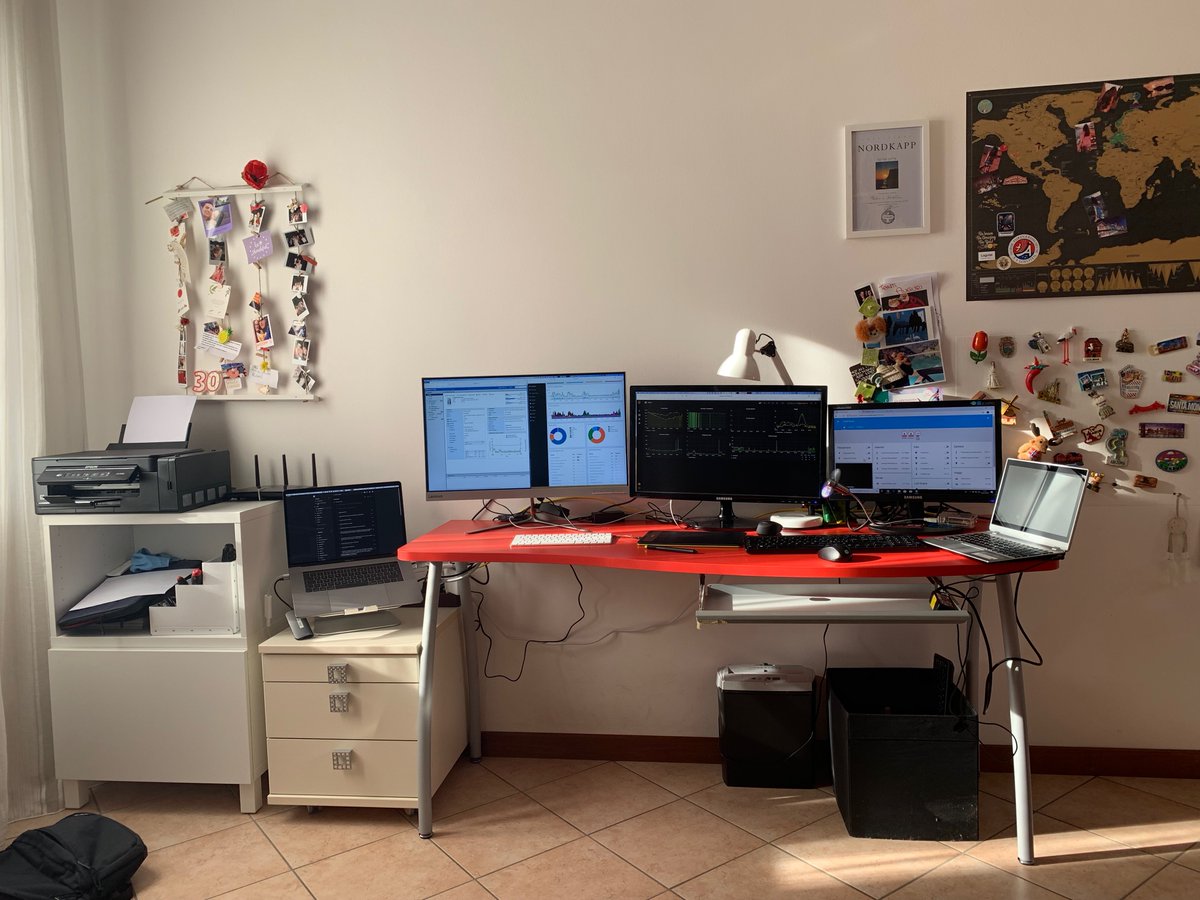
– limitare i consumi elettrici: l’HomeLab (monitor esclusi, quindi Intel Nuc, disco esterno, router Internet + Wifi, UPS e qualche Raspberry) consuma appena 40watt! Con i 2 monitor principali accesi, arrivo a 120watt!
Direi che per la premessa è tutto.
Ora ci dobbiamo concentrare sui dettagli tecnici – più divertenti – relativi ai vari punti. I prossimi articoli quindi andranno a esplorare nel dettaglio tutti i punti sopra riportati, uno alla volta (man mano aggiungerò link a questo articolo).
Se avete domande o preferenze su quale argomento trattare per primo non esitate a commentare.
What is this? Every day I read a lot of articles about computer programming and languages, infrastructures, new technologies, quick tips, trends, architectures and so on. I read them immediately or put in my “read later” list. All my readings helped me to grow and learn new things…so why don’t share them with my readers? For this reason, I decided to publish and share, every monday, a list of the links I came accross during the past days.
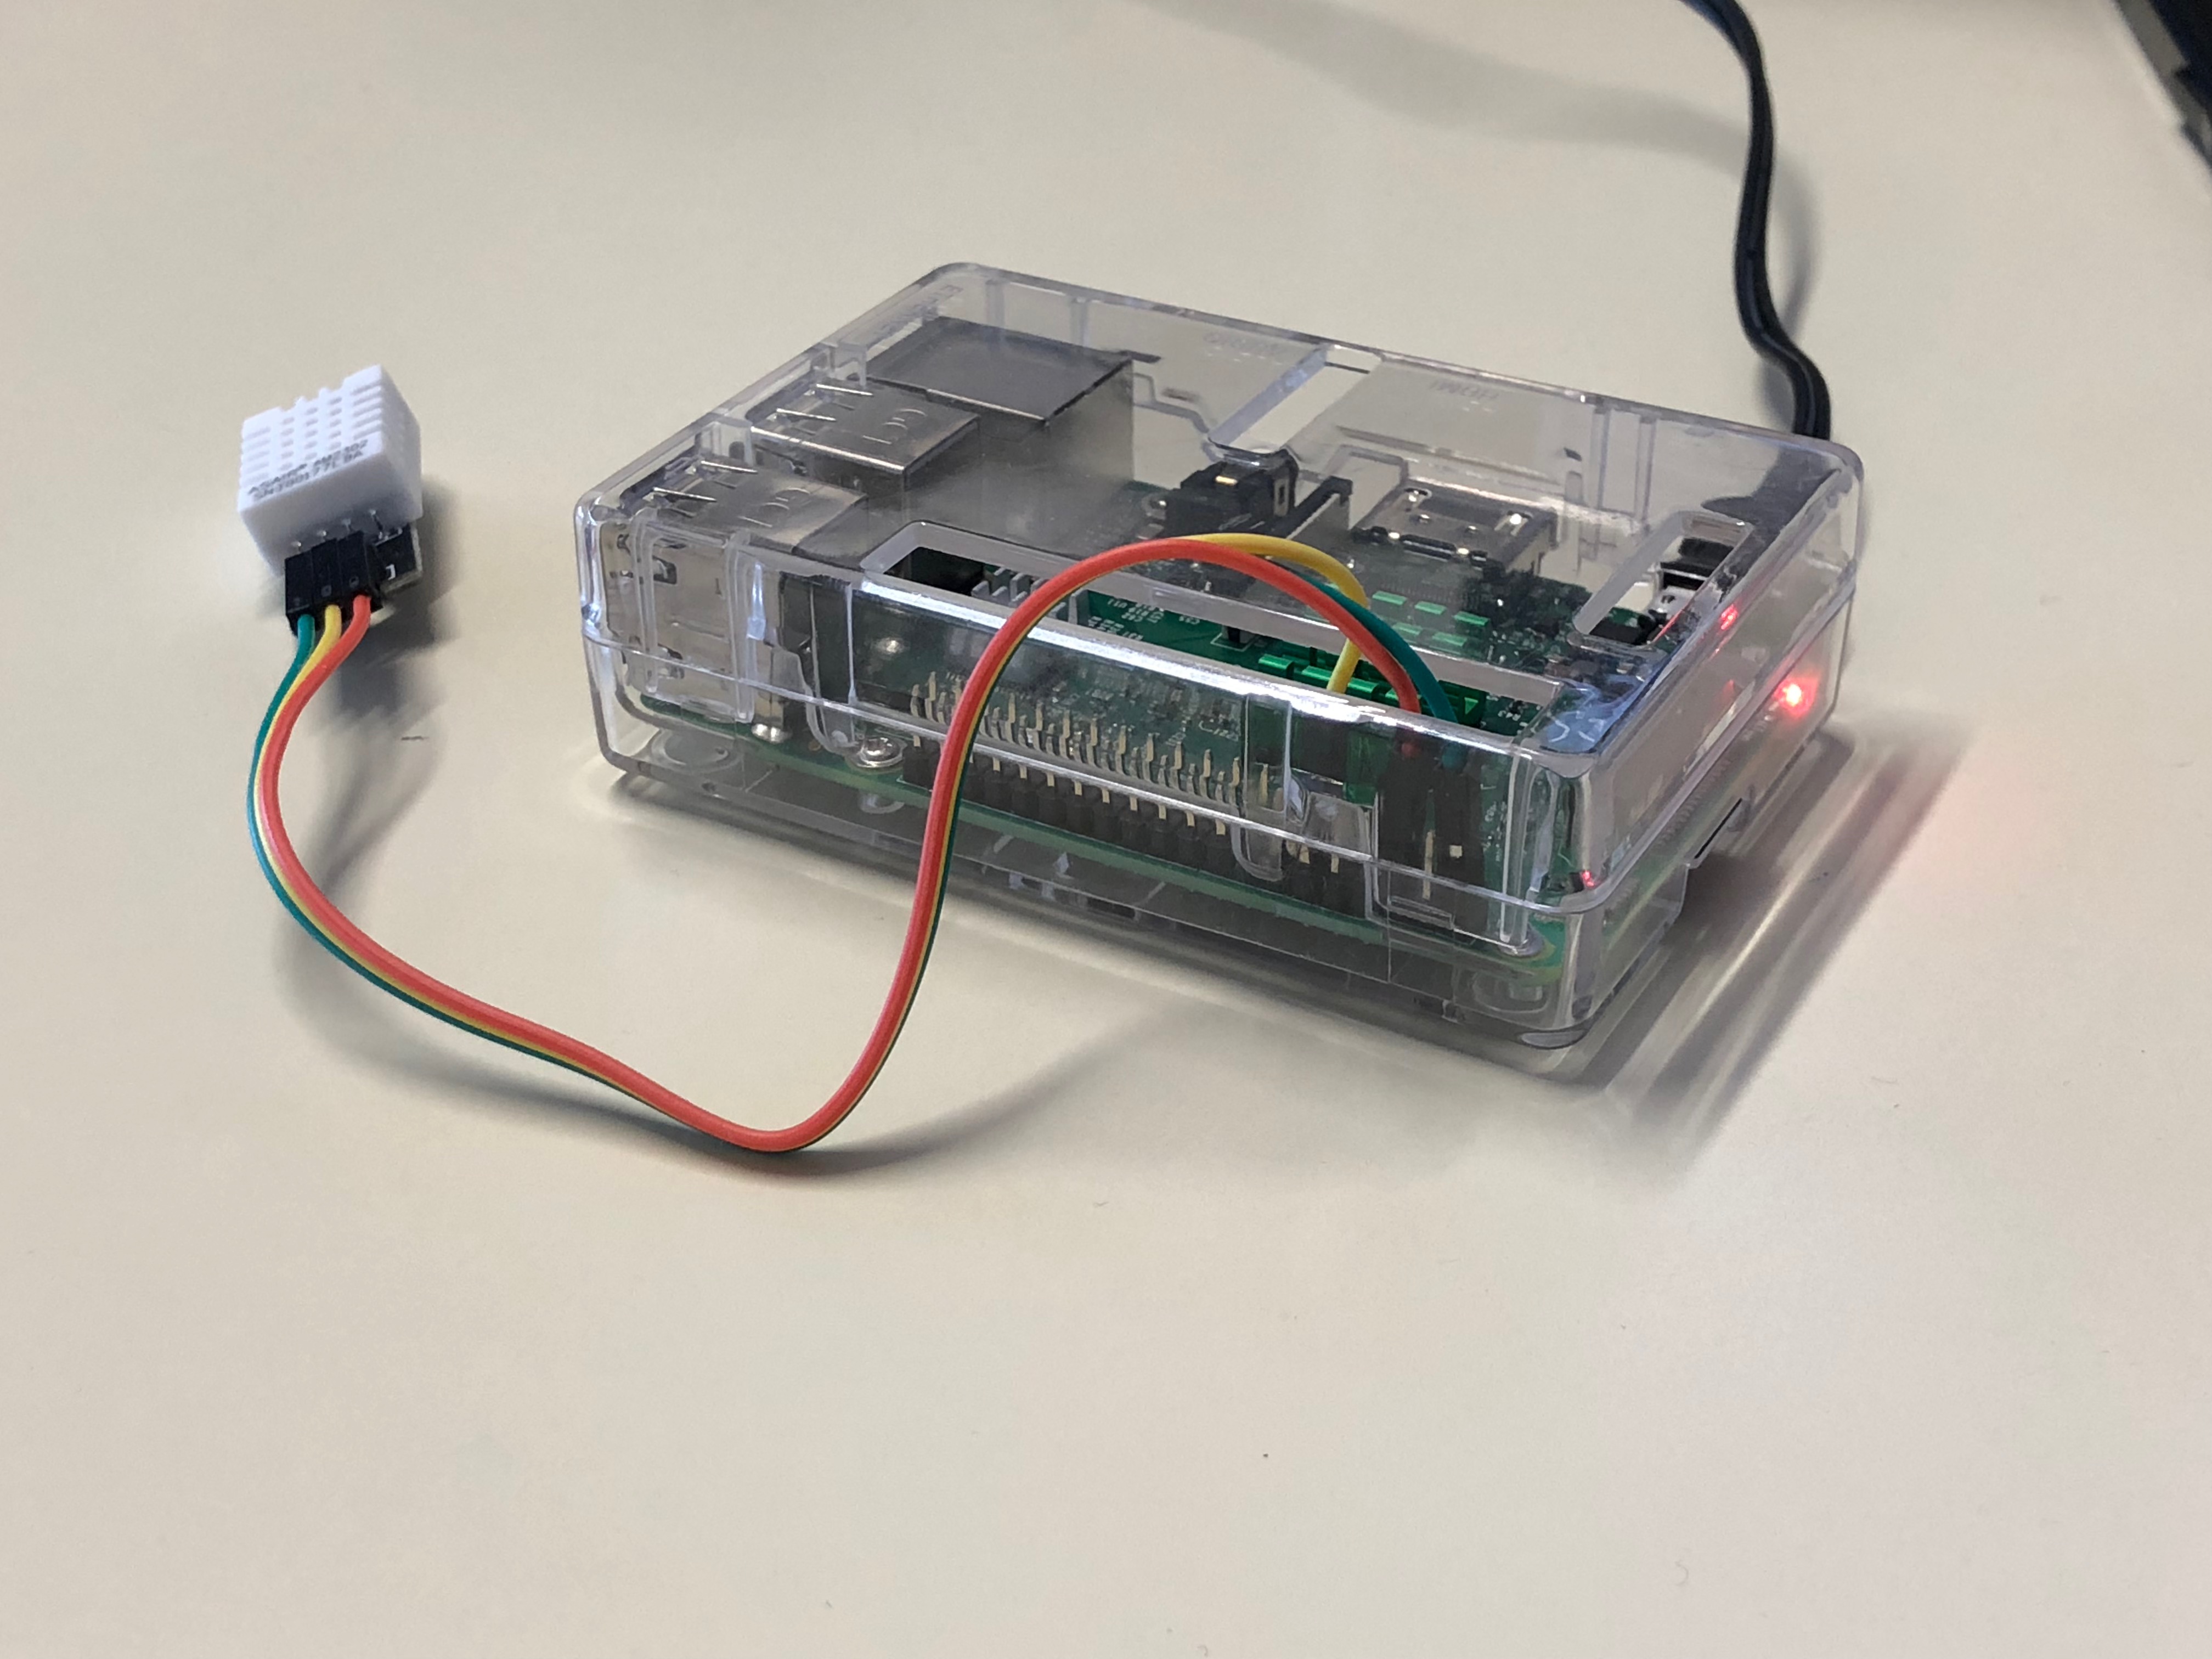
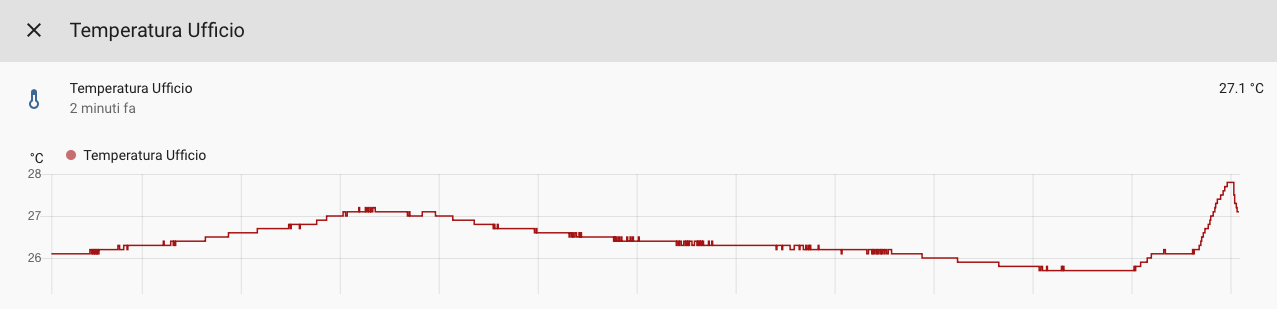
Node.js project for reading temperatures from DHT11 – DHT22 and send it to an MQTT Broker via Raspberry Pi – link
Create a budget Temperature and Humidity Wireless monitor with Raspberry Pi and DHT sensors.
Each sensor, if using Pi Zero W and DHT22, costs about 35€
The linked project is a Node.js wrapper that can be added to the Raspberry crontab and:
– reads the temperature from the attached sensor
– sends it to an MQTT broker
Then, you can read the temperature from your central Home Assistant
In the next days I’ll write a detailed post about the complete project, that consists of a central hub (Raspberry Pi + Home Assistant) and many Raspberry Pi Zero W as sensors for the rooms.
Stay tuned for the detailed post in few days
An example of response time and server costs optimization – link and link
I’m sure that you know Troy Hunt. And if you don’t…he is the creator of https://haveibeenpwned.com , a database containing over 500 million passwords from previous data breaches in big companies like LinkedIn, Adobe etc…
He recently added a free-to-use and free-to-integrate API for searching if a password is in the pwned database, sending only the first 5 digits of the SHA-1 hash of the password, with a simple call like this
https://api.pwnedpasswords.com/range/21BD1
This can be integrated in every password form (web, application) and suggest users if their password is in the pwned database.
But we are not here to talk about the service 🙂 but how it scaled a lot and why it is so fast.
Click on the first link for a very interesting article about how he optimized performances (calls below 50ms) of the hosting.
In the second link, you can find another very interesting article that focus on the costs, and how it’s possible to spend LESS THAN 1$/month to run a service that receives more than 140 million hits per month.
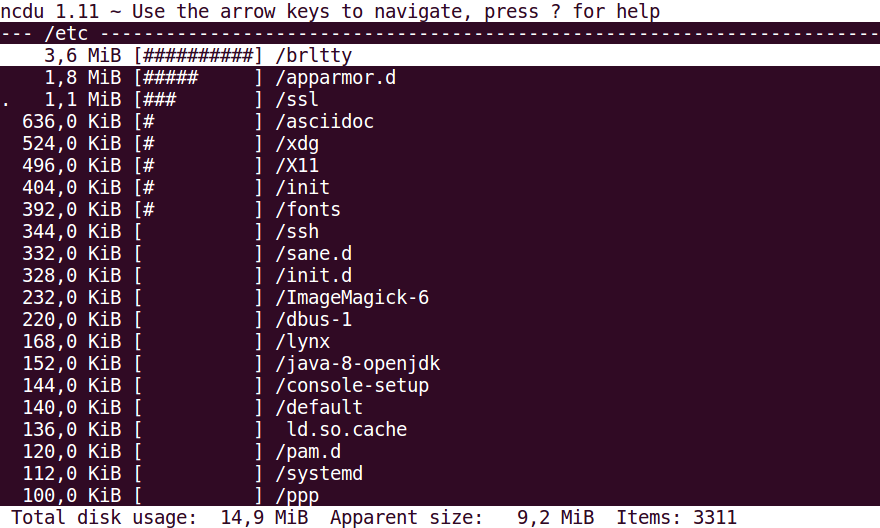
Linux o MacOS without free space? Do you want to find quickly that folder with a bunch of .old|.bak|.wtf files that you haven’t touched in the last 10 years?
ncdu (NCursesDisk Usage) is a disk utility for Unix systems. Its name refers to its similar purpose to the du utility, but ncdu uses a text-based user interface under the [n]curses programming library.[1] Users can navigate the list using the arrow keys and delete files that are taking up too much space by pressing the ‘d’ key. Version 1.09 and later can export the file listing in JSON format.
That’s all for today’s LombaXMonday, if you liked it, have any question or want to let me know that this article sucks, don’t hesitate to add a comment 🙂
What is this? Every day I read a lot of articles about computer programming and languages, infrastructures, new technologies, quick tips, trends, architectures and so on. I read them immediately or put in my “read later” list. All my readings helped me to grow and learn new things…so why don’t share them with my readers? For this reason, I decided to publish and share, every monday, a list of the links I came accross during the past days.
An impressive explanation of what is branch prediction and how knowing it could help us to write more efficient code. Read the whole question and the accepted answer, it’s worth it
A tool written in Javascript by Luciano Mammino (more info in the link), for cracking JWT Token via bruteforce. This tool is distributed, it means that you can publish a server (take track of the job) and as many client as you want, to increase the cpu power.
You are using a fantastic npm dependency but…there is a bug. And you can’t modify the source in the node_modules because at every npm install/update you lose your modifications? Don’t worry, this tool will save your life (personally, I prefer to fork and update the dependency directly on Github…but “de gustibus”)
That’s all for today’s LombaXMonday, if you liked it, have any question or want to let me know that this article sucks, don’t hesitate to add a comment 🙂